α-Synuclein Aggregates in Parkinson’s Disease
Group 30: SAA Analysis from PPMI Projects 155 & 237
2025-12-02
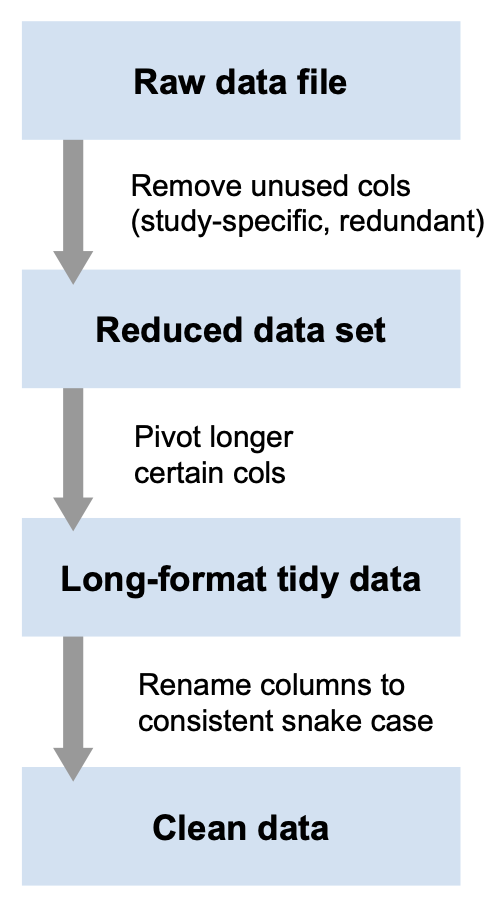
Tidying and augmenting
Tidy data makes it much easier to handle. Requirements:
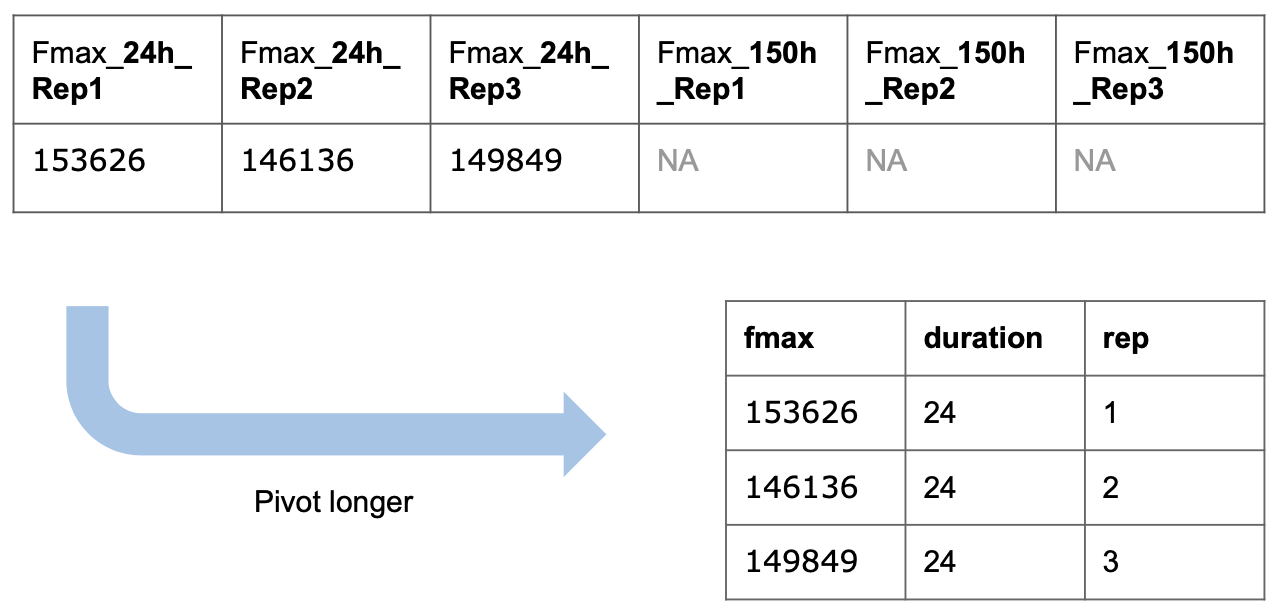
Each column is one variable (Not the case initially)
Each row is one observation
Each cell is one value
Augmenting
Days from baseline: Calculated from rundates
Mean of fmax for each visit
Our own SAA_result
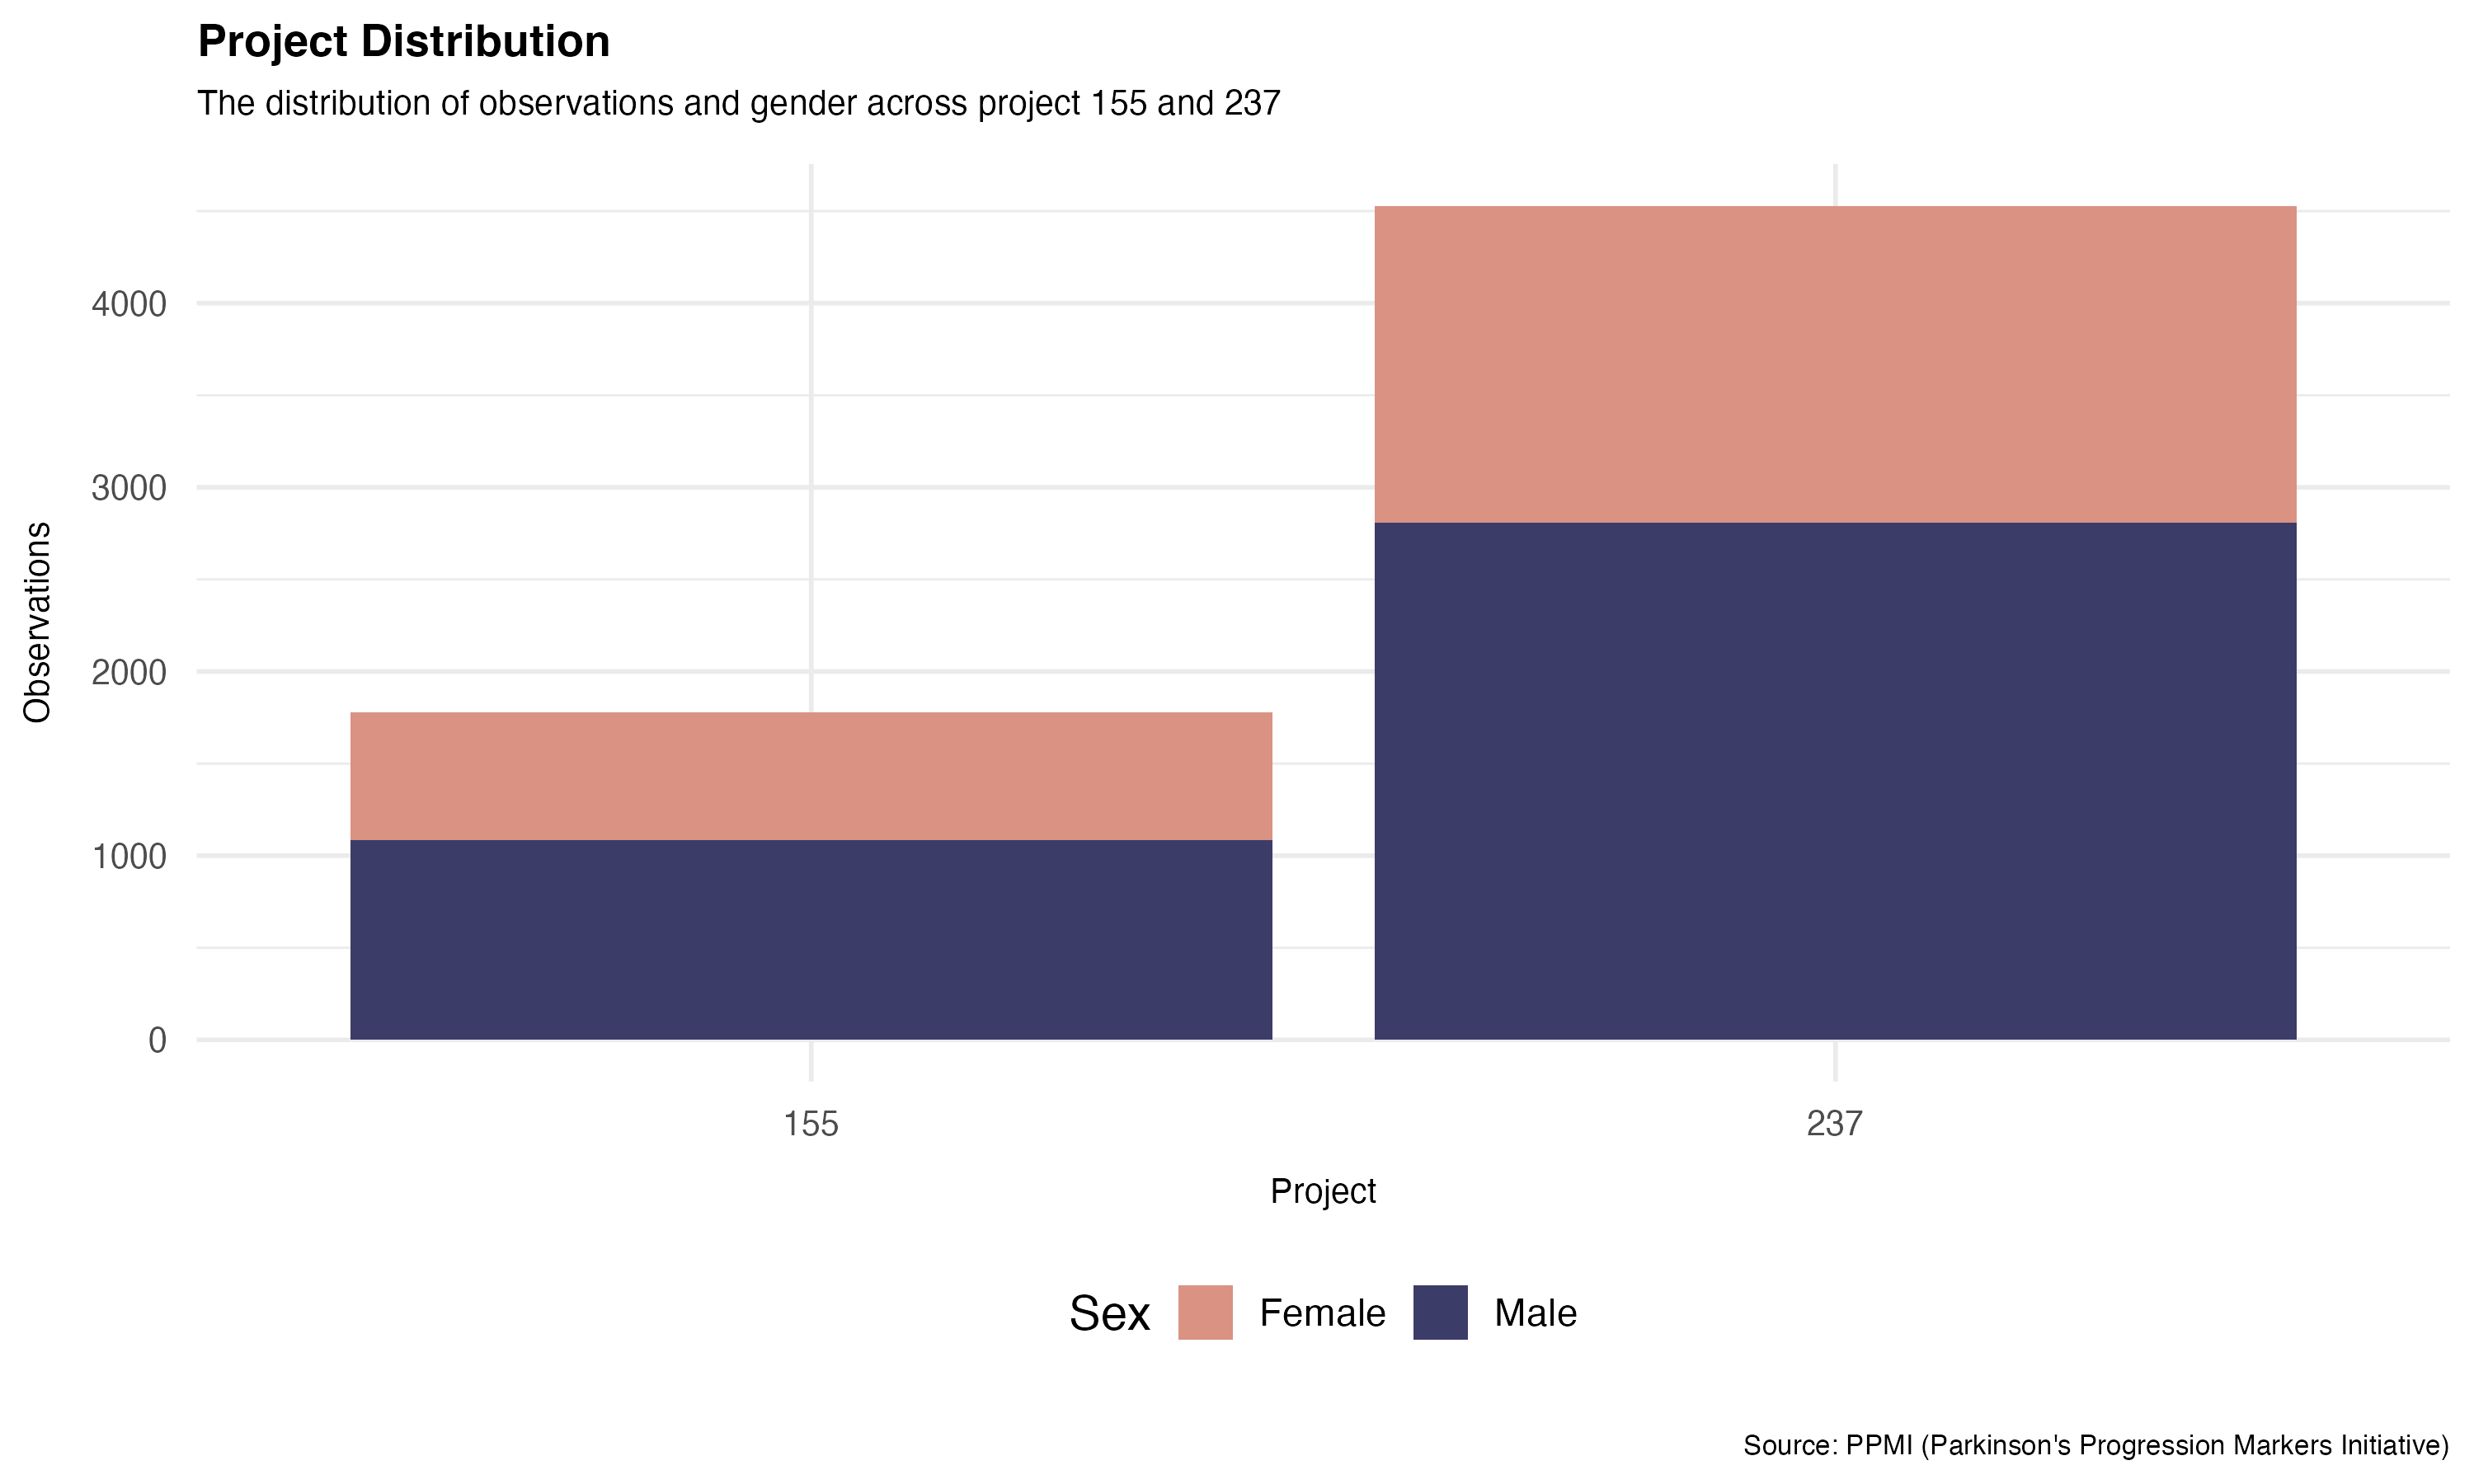
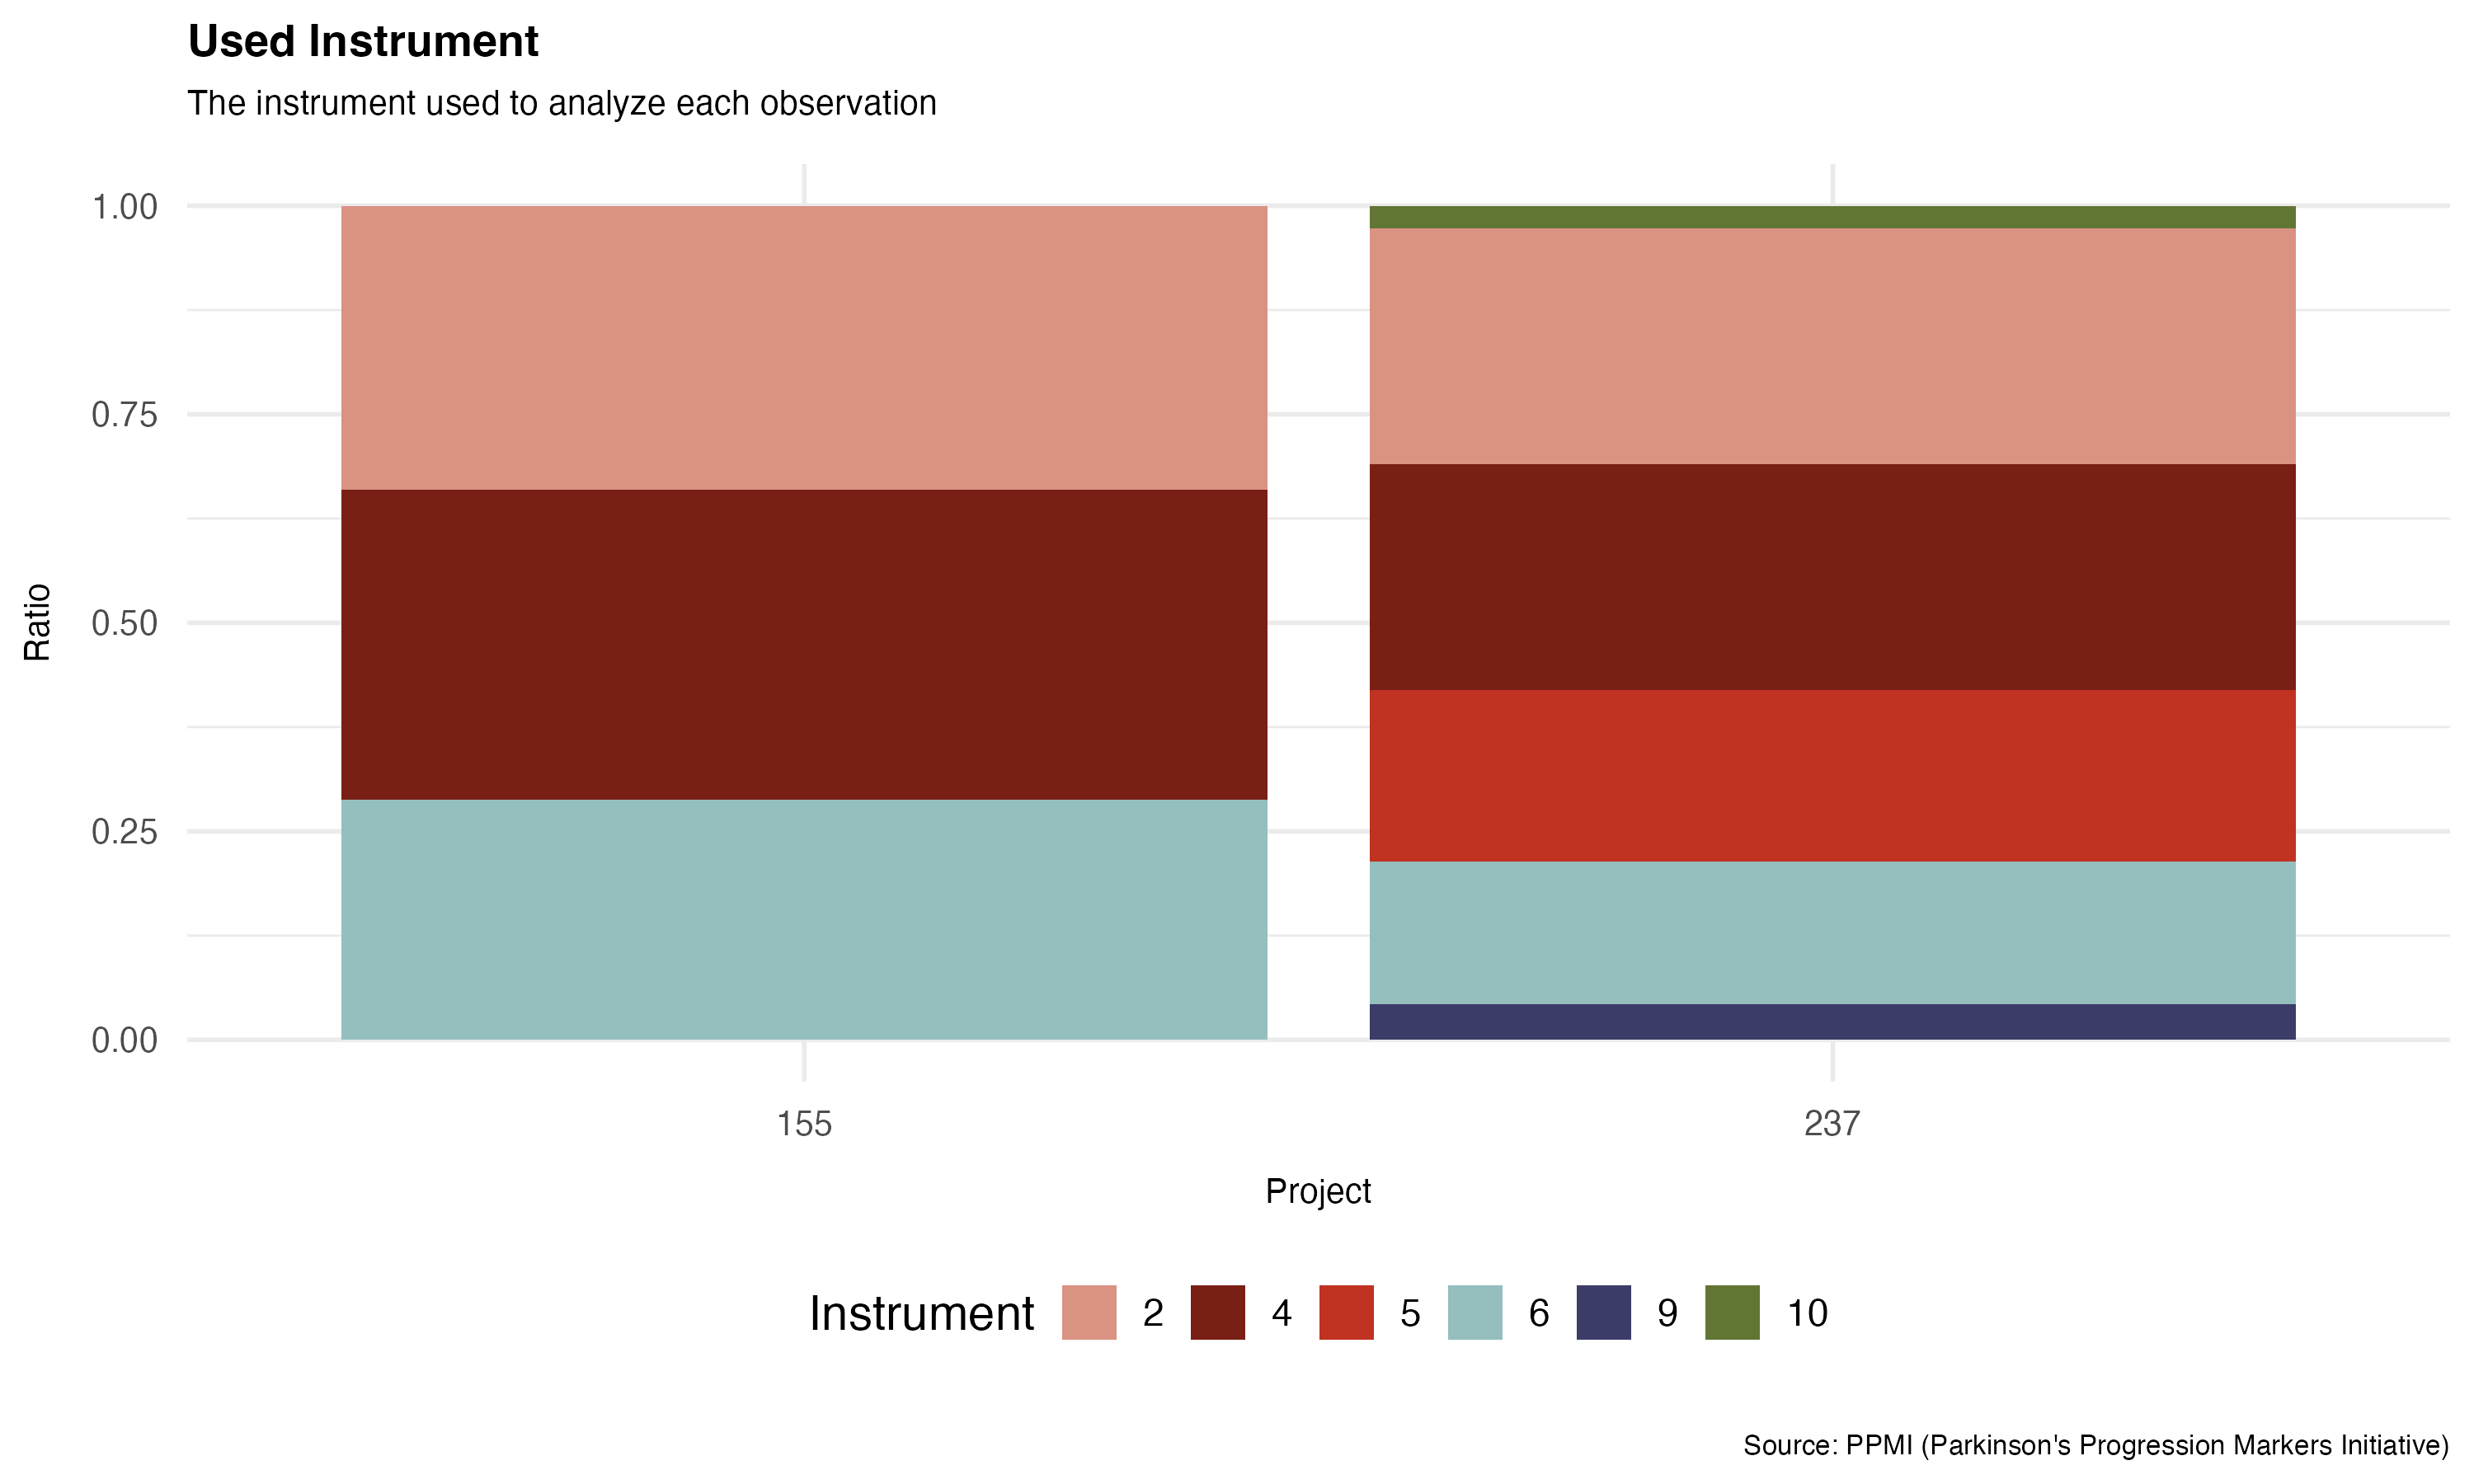
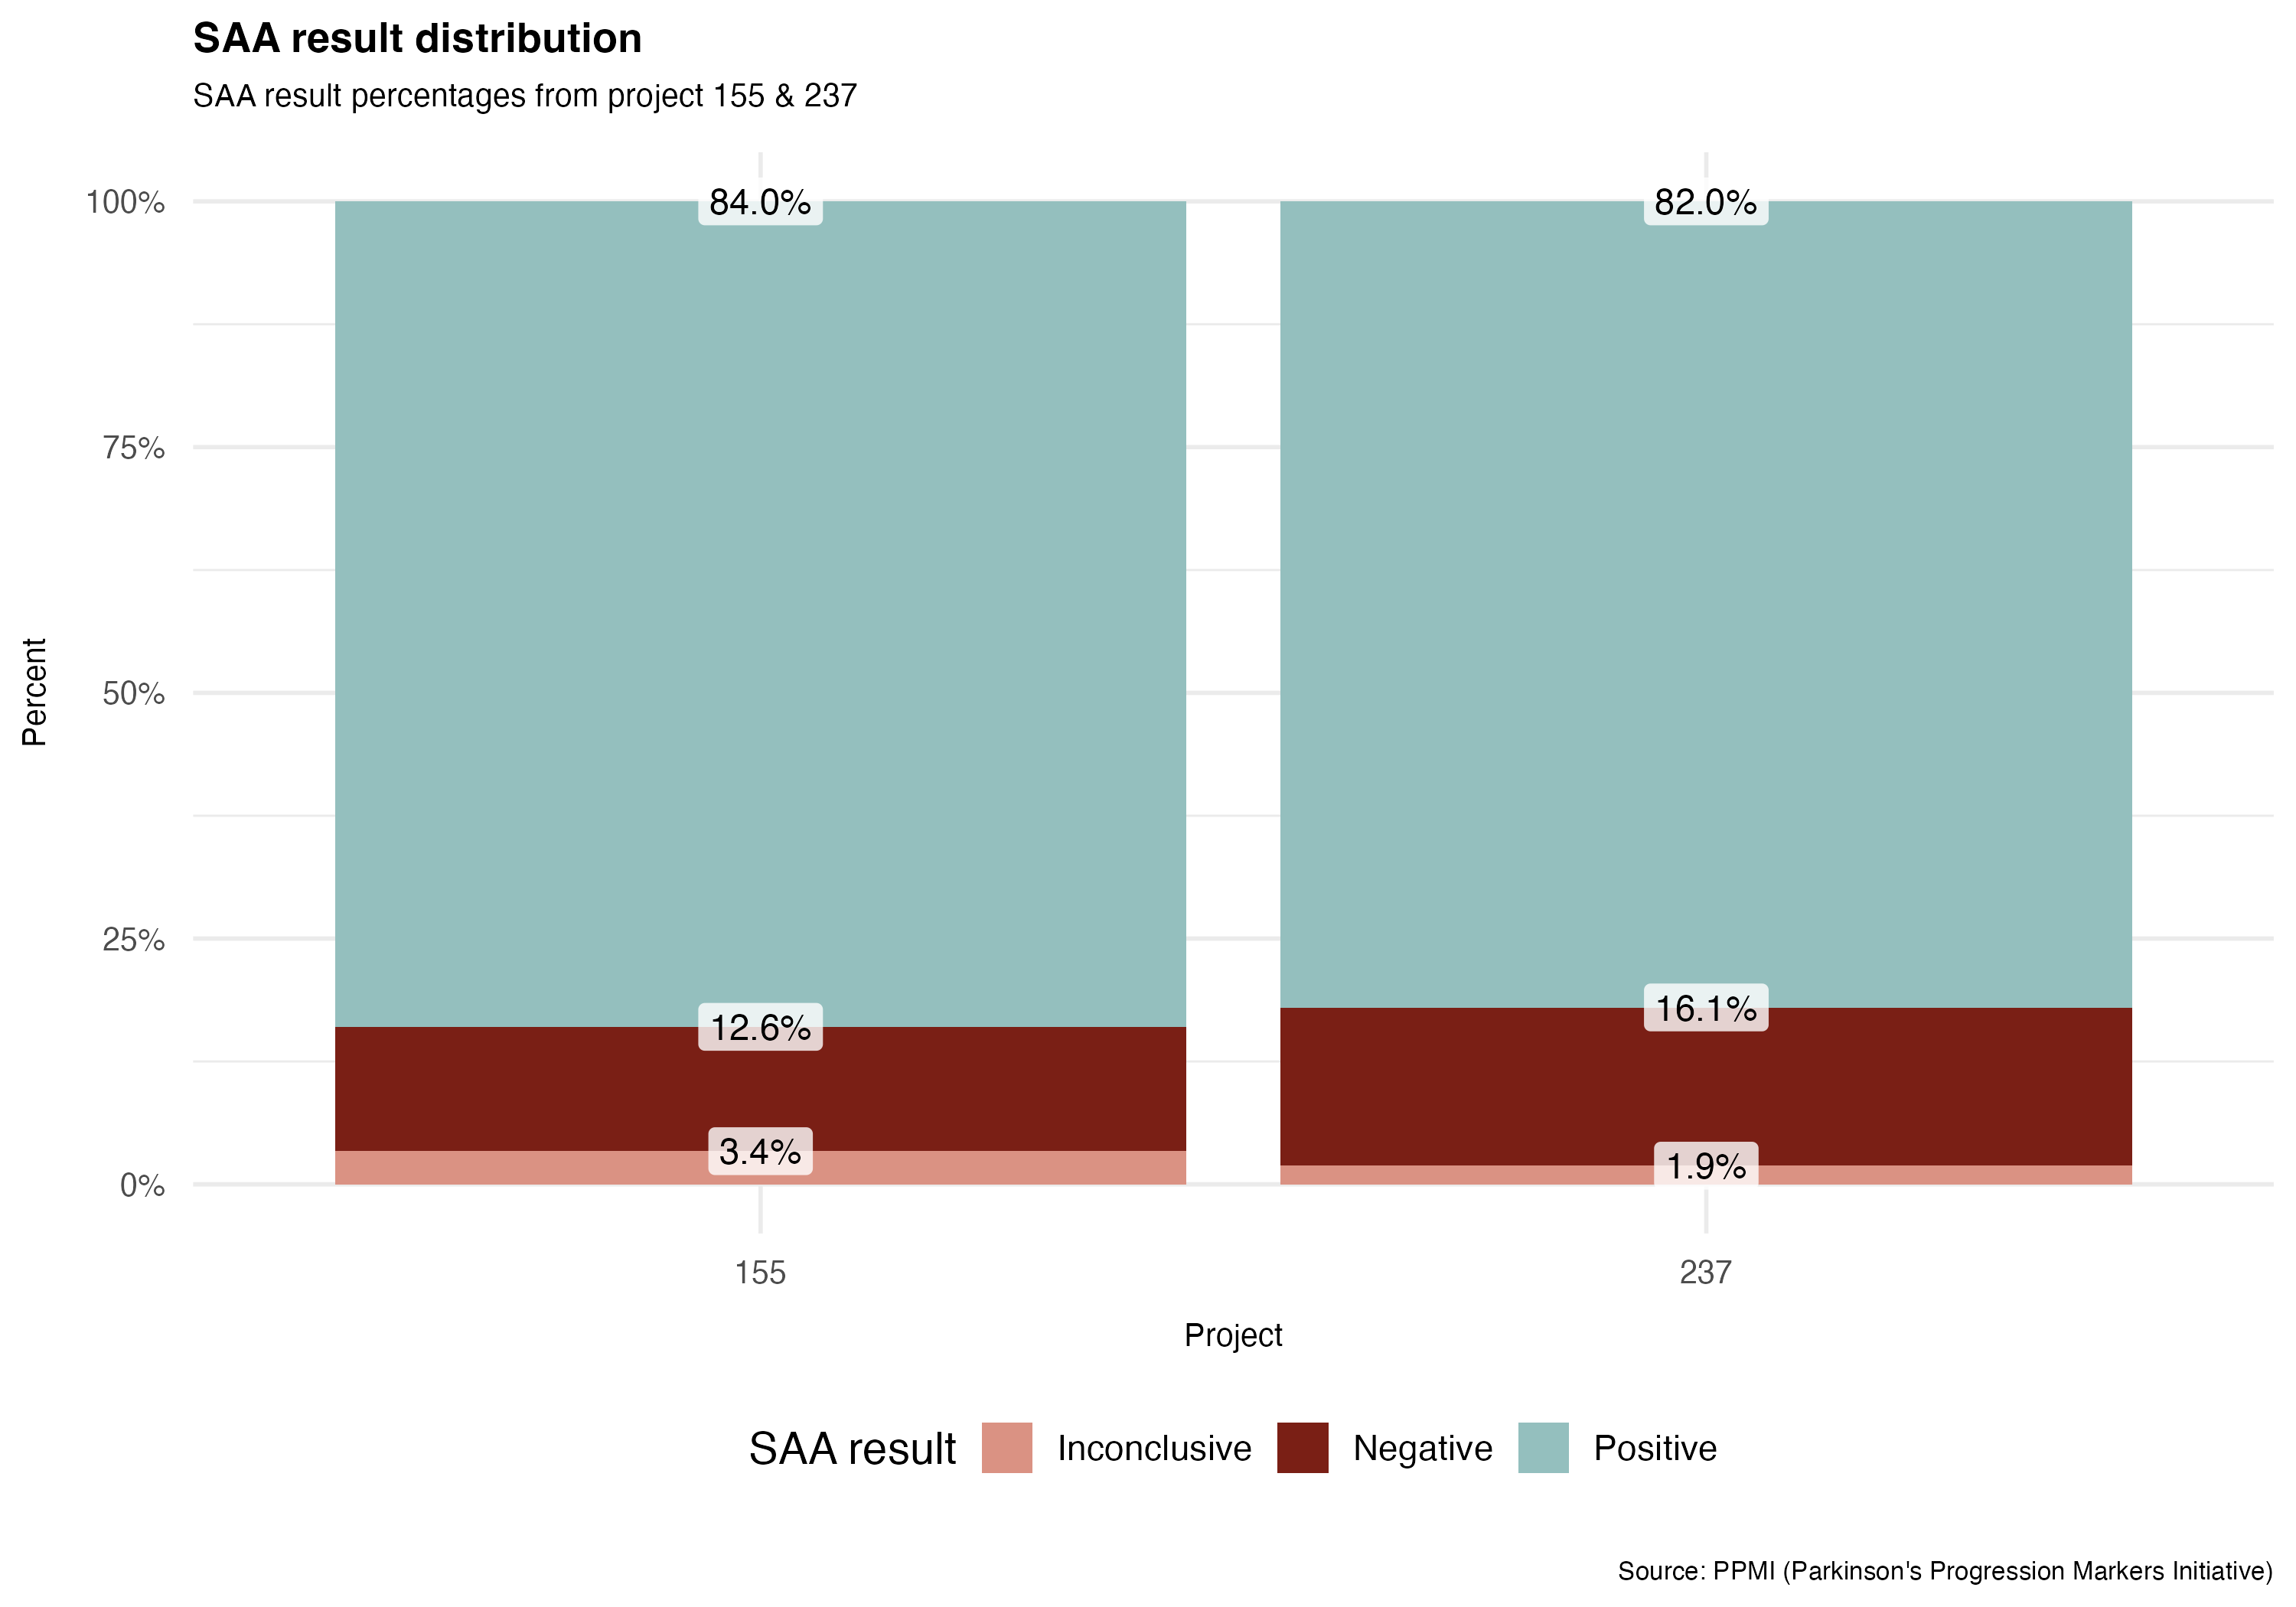
Descriptive
- Two projects: 155 (150h) and 237 (24h)
- 1300 individuals, almost 1900 observations
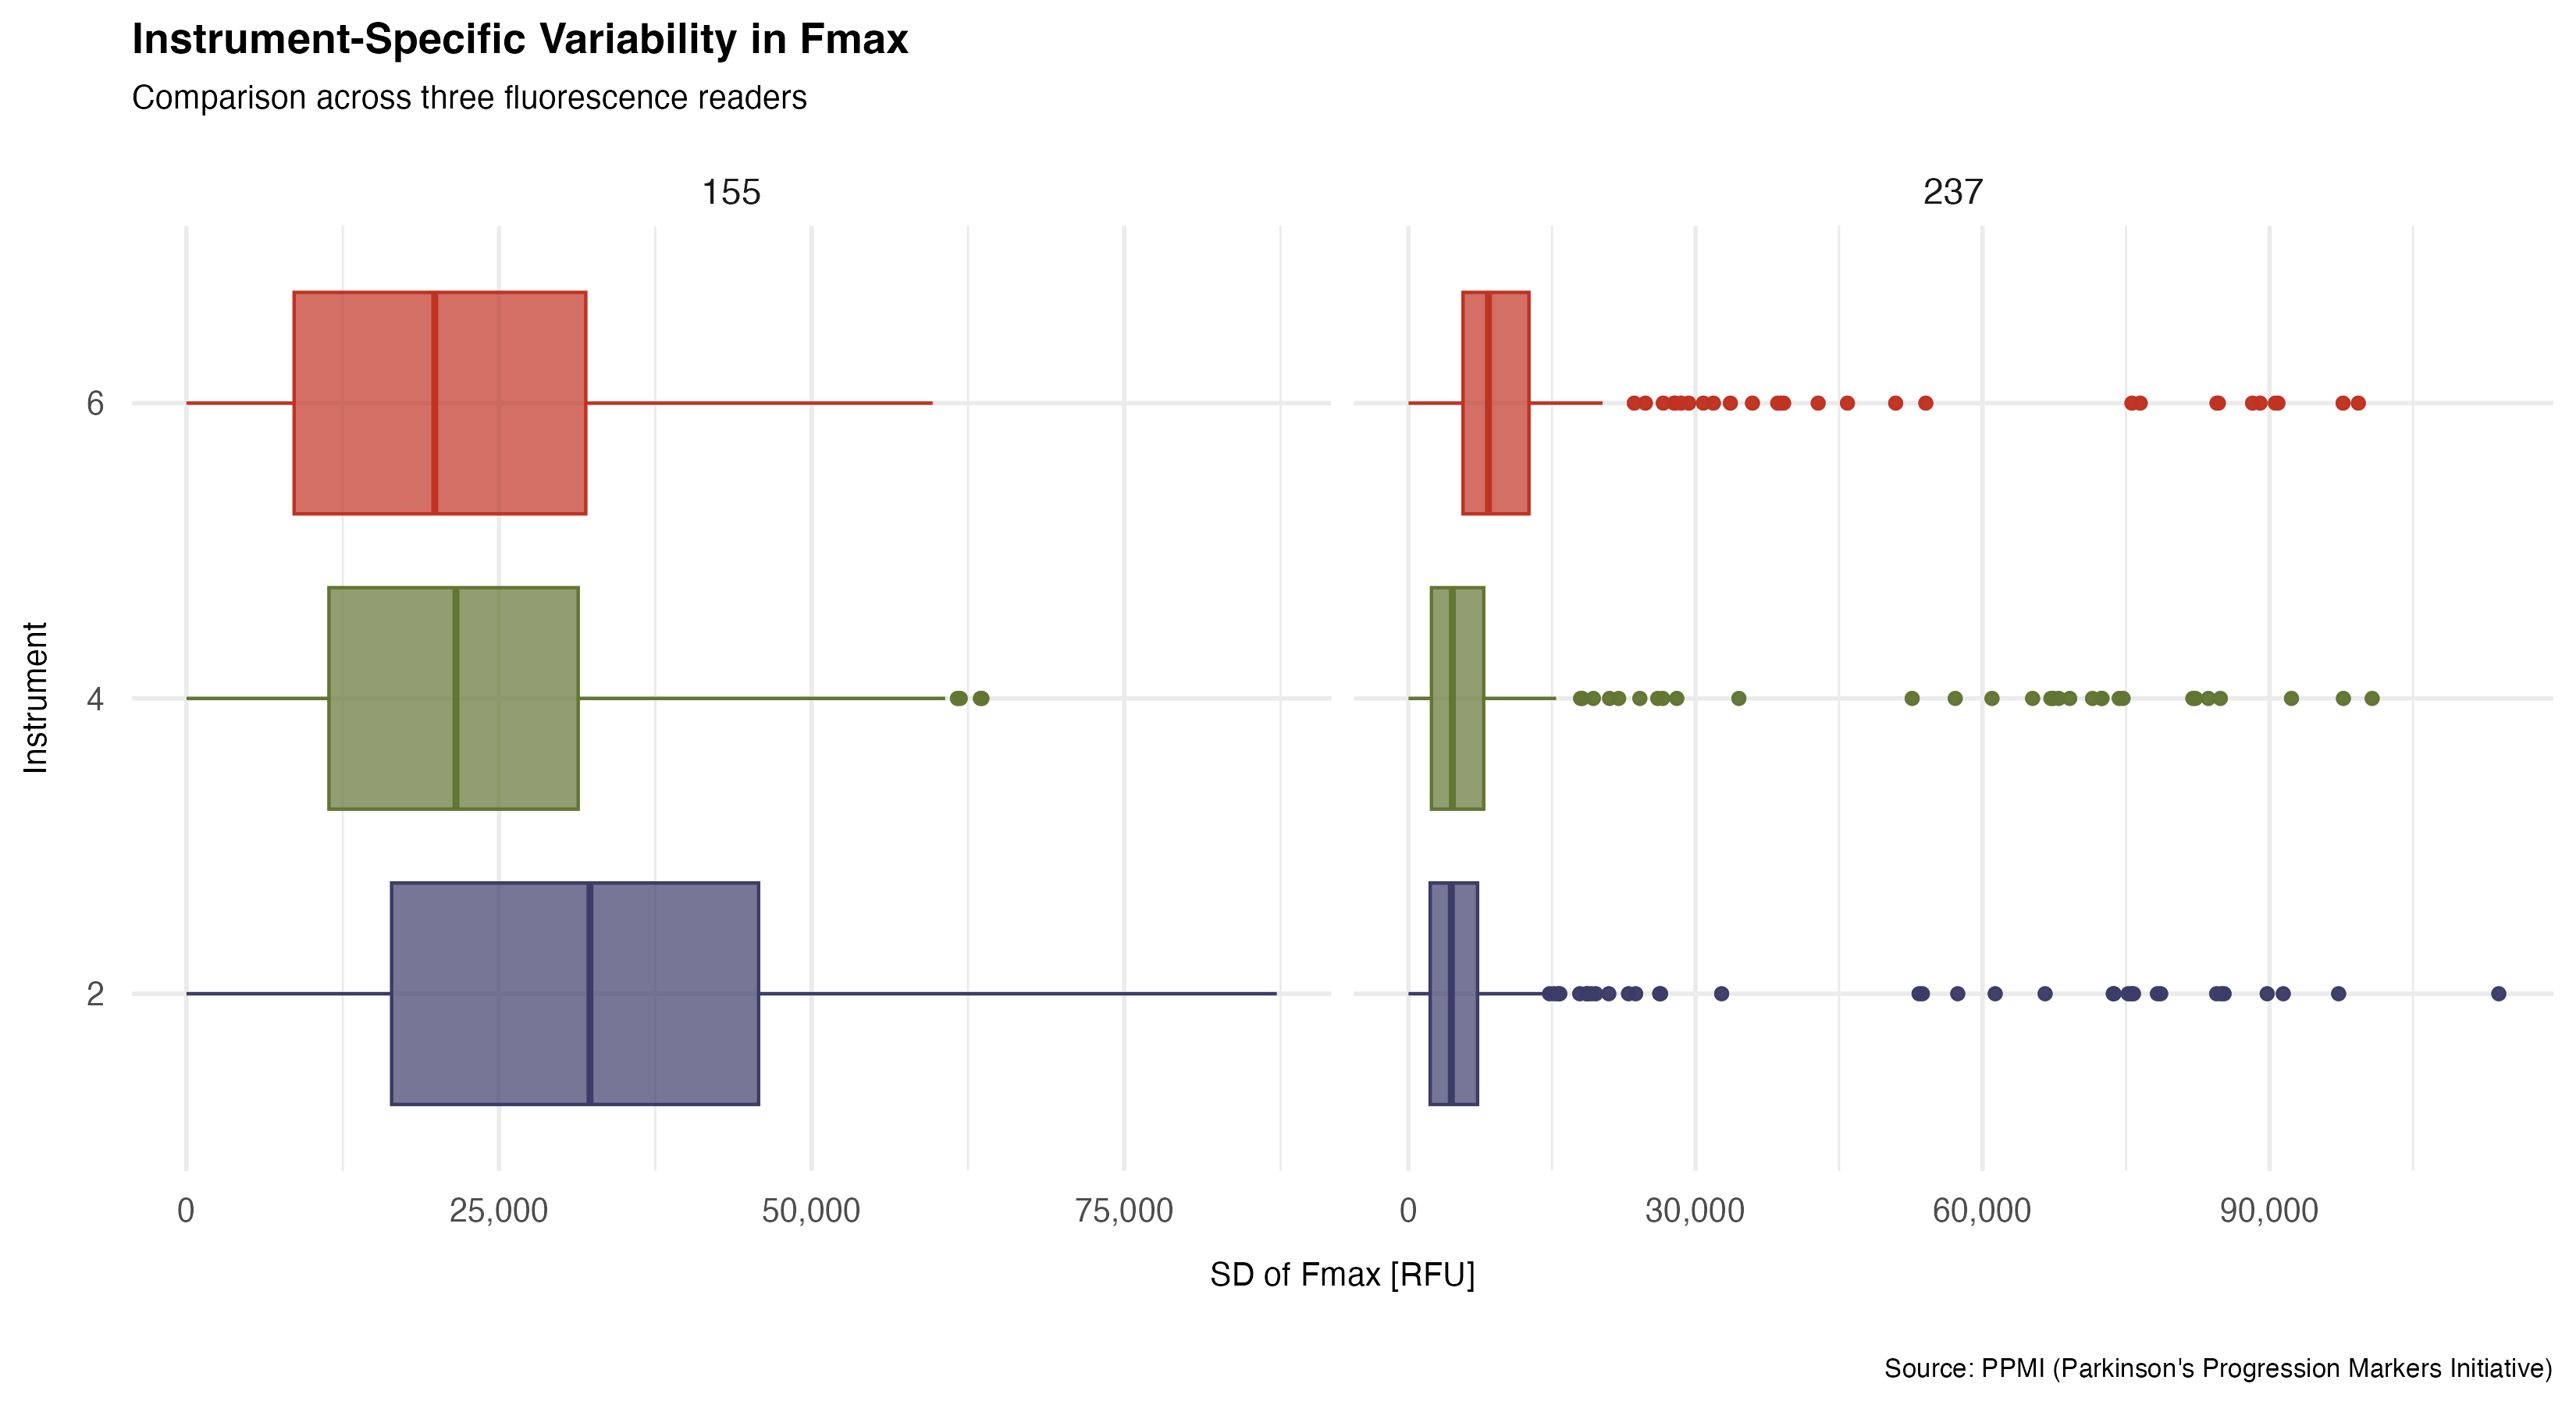
- Frequency of instrument used
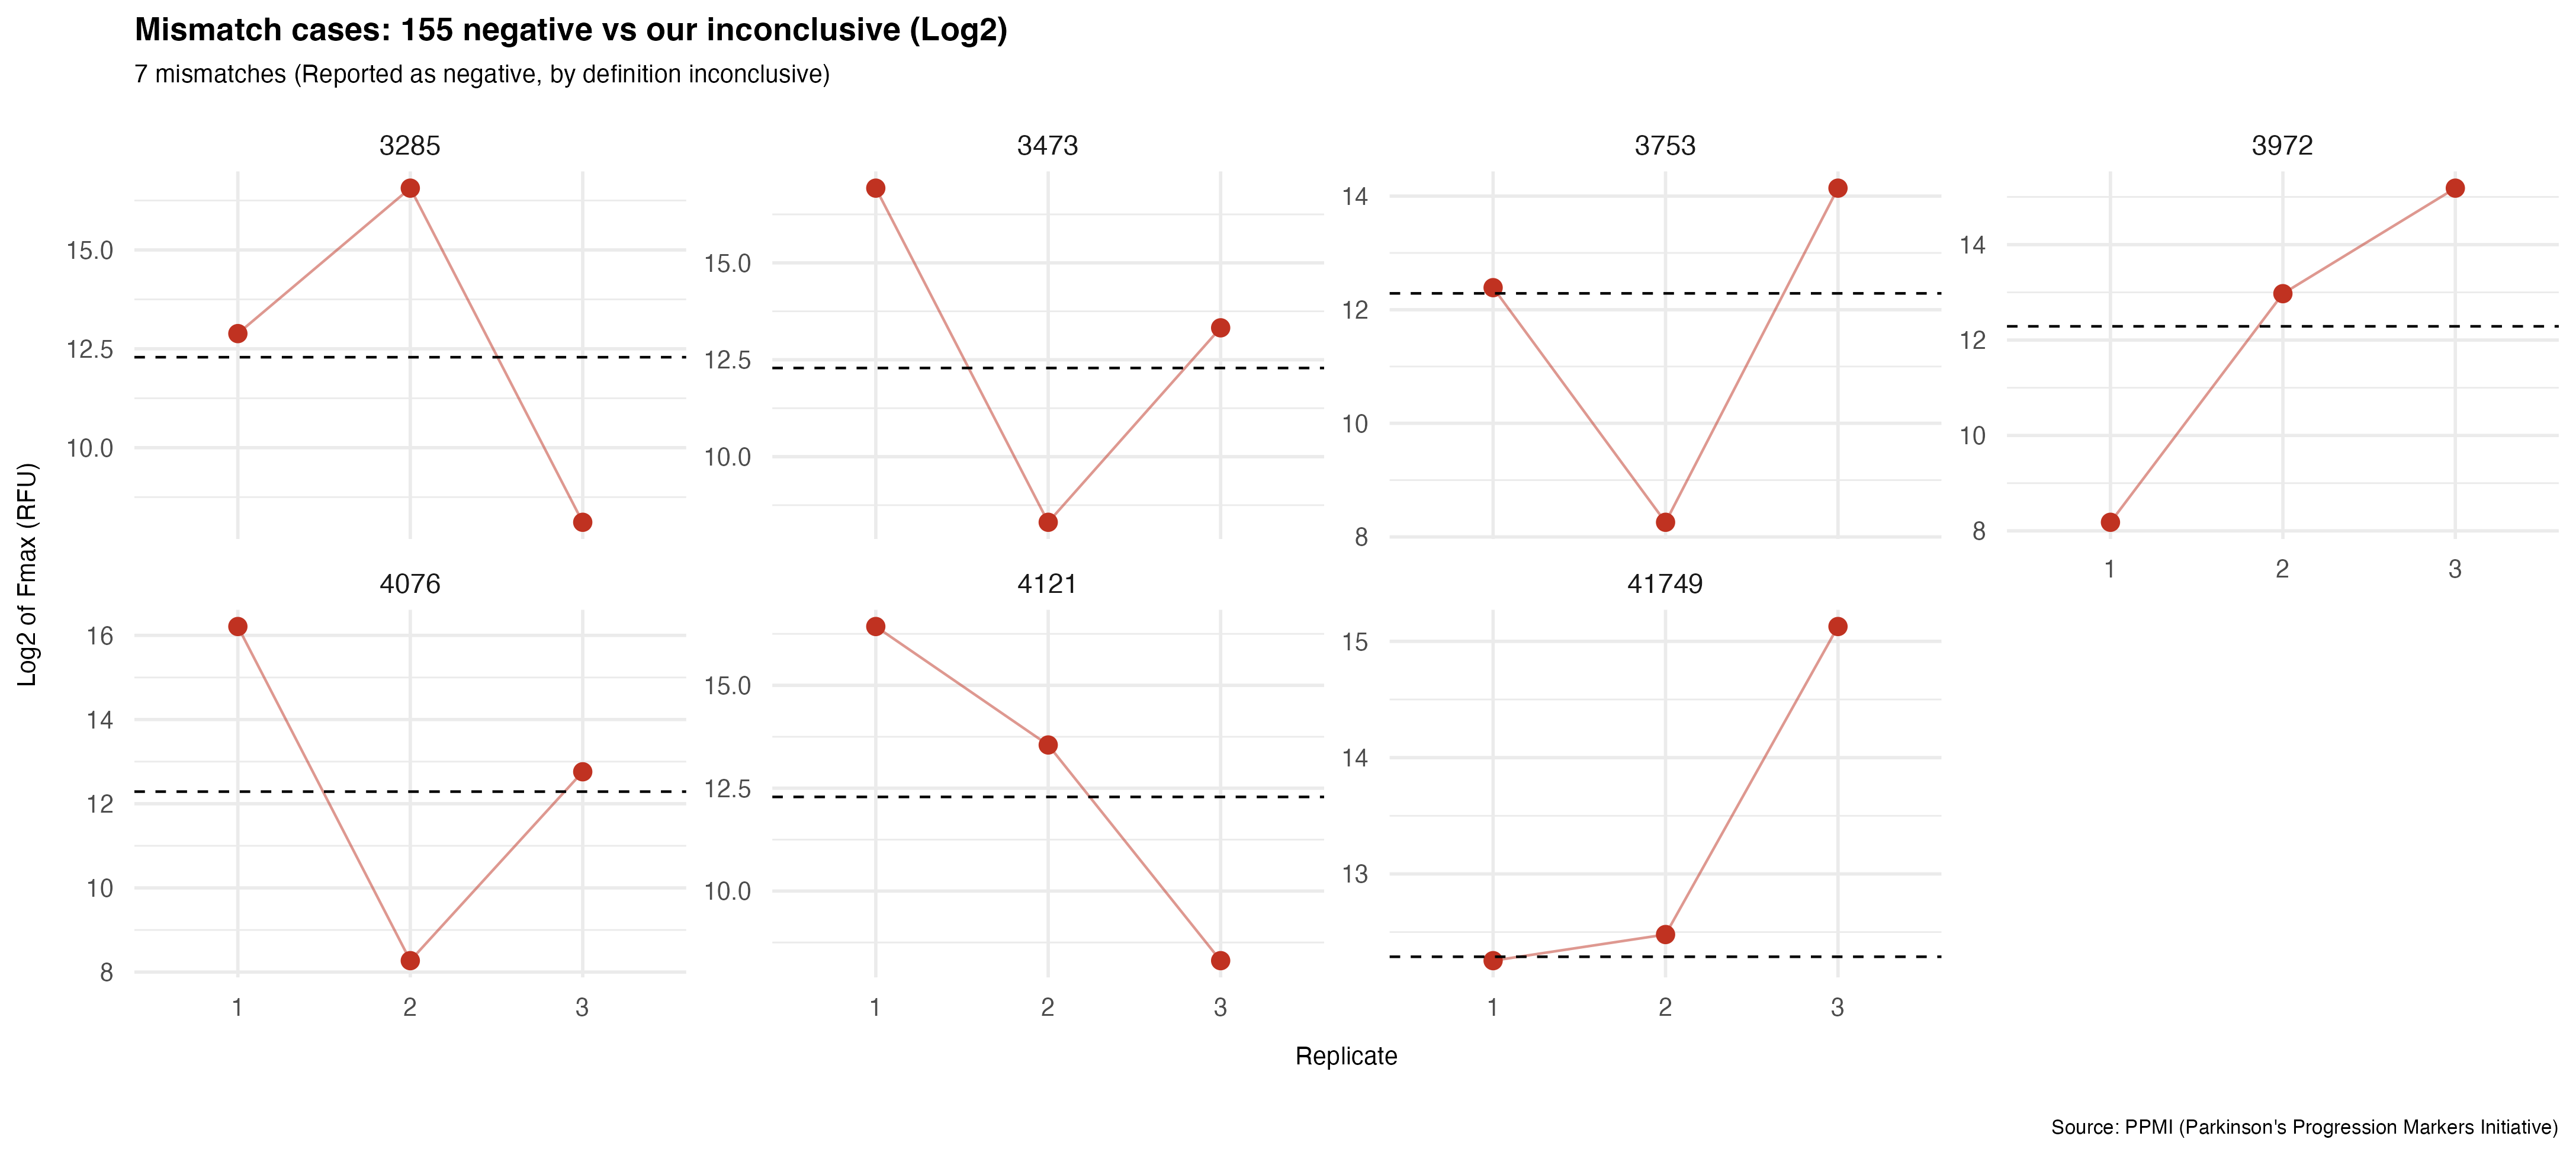
SAA quality check
SAA result and SAA custom quality check
A non-mentioned criteria?
Low fmax (200–600 RFU), huge, moderate
Hard to know for sure
| Result | Project 155 |
|---|---|
| Positive | All replicates Fmax ≥ 5,000 RFU |
| Negative | 0 or 1 replicate Fmax ≥ 5,000 RFU |
| Inconclusive | 2 replicates Fmax ≥ 5,000 RFU |
SAA results
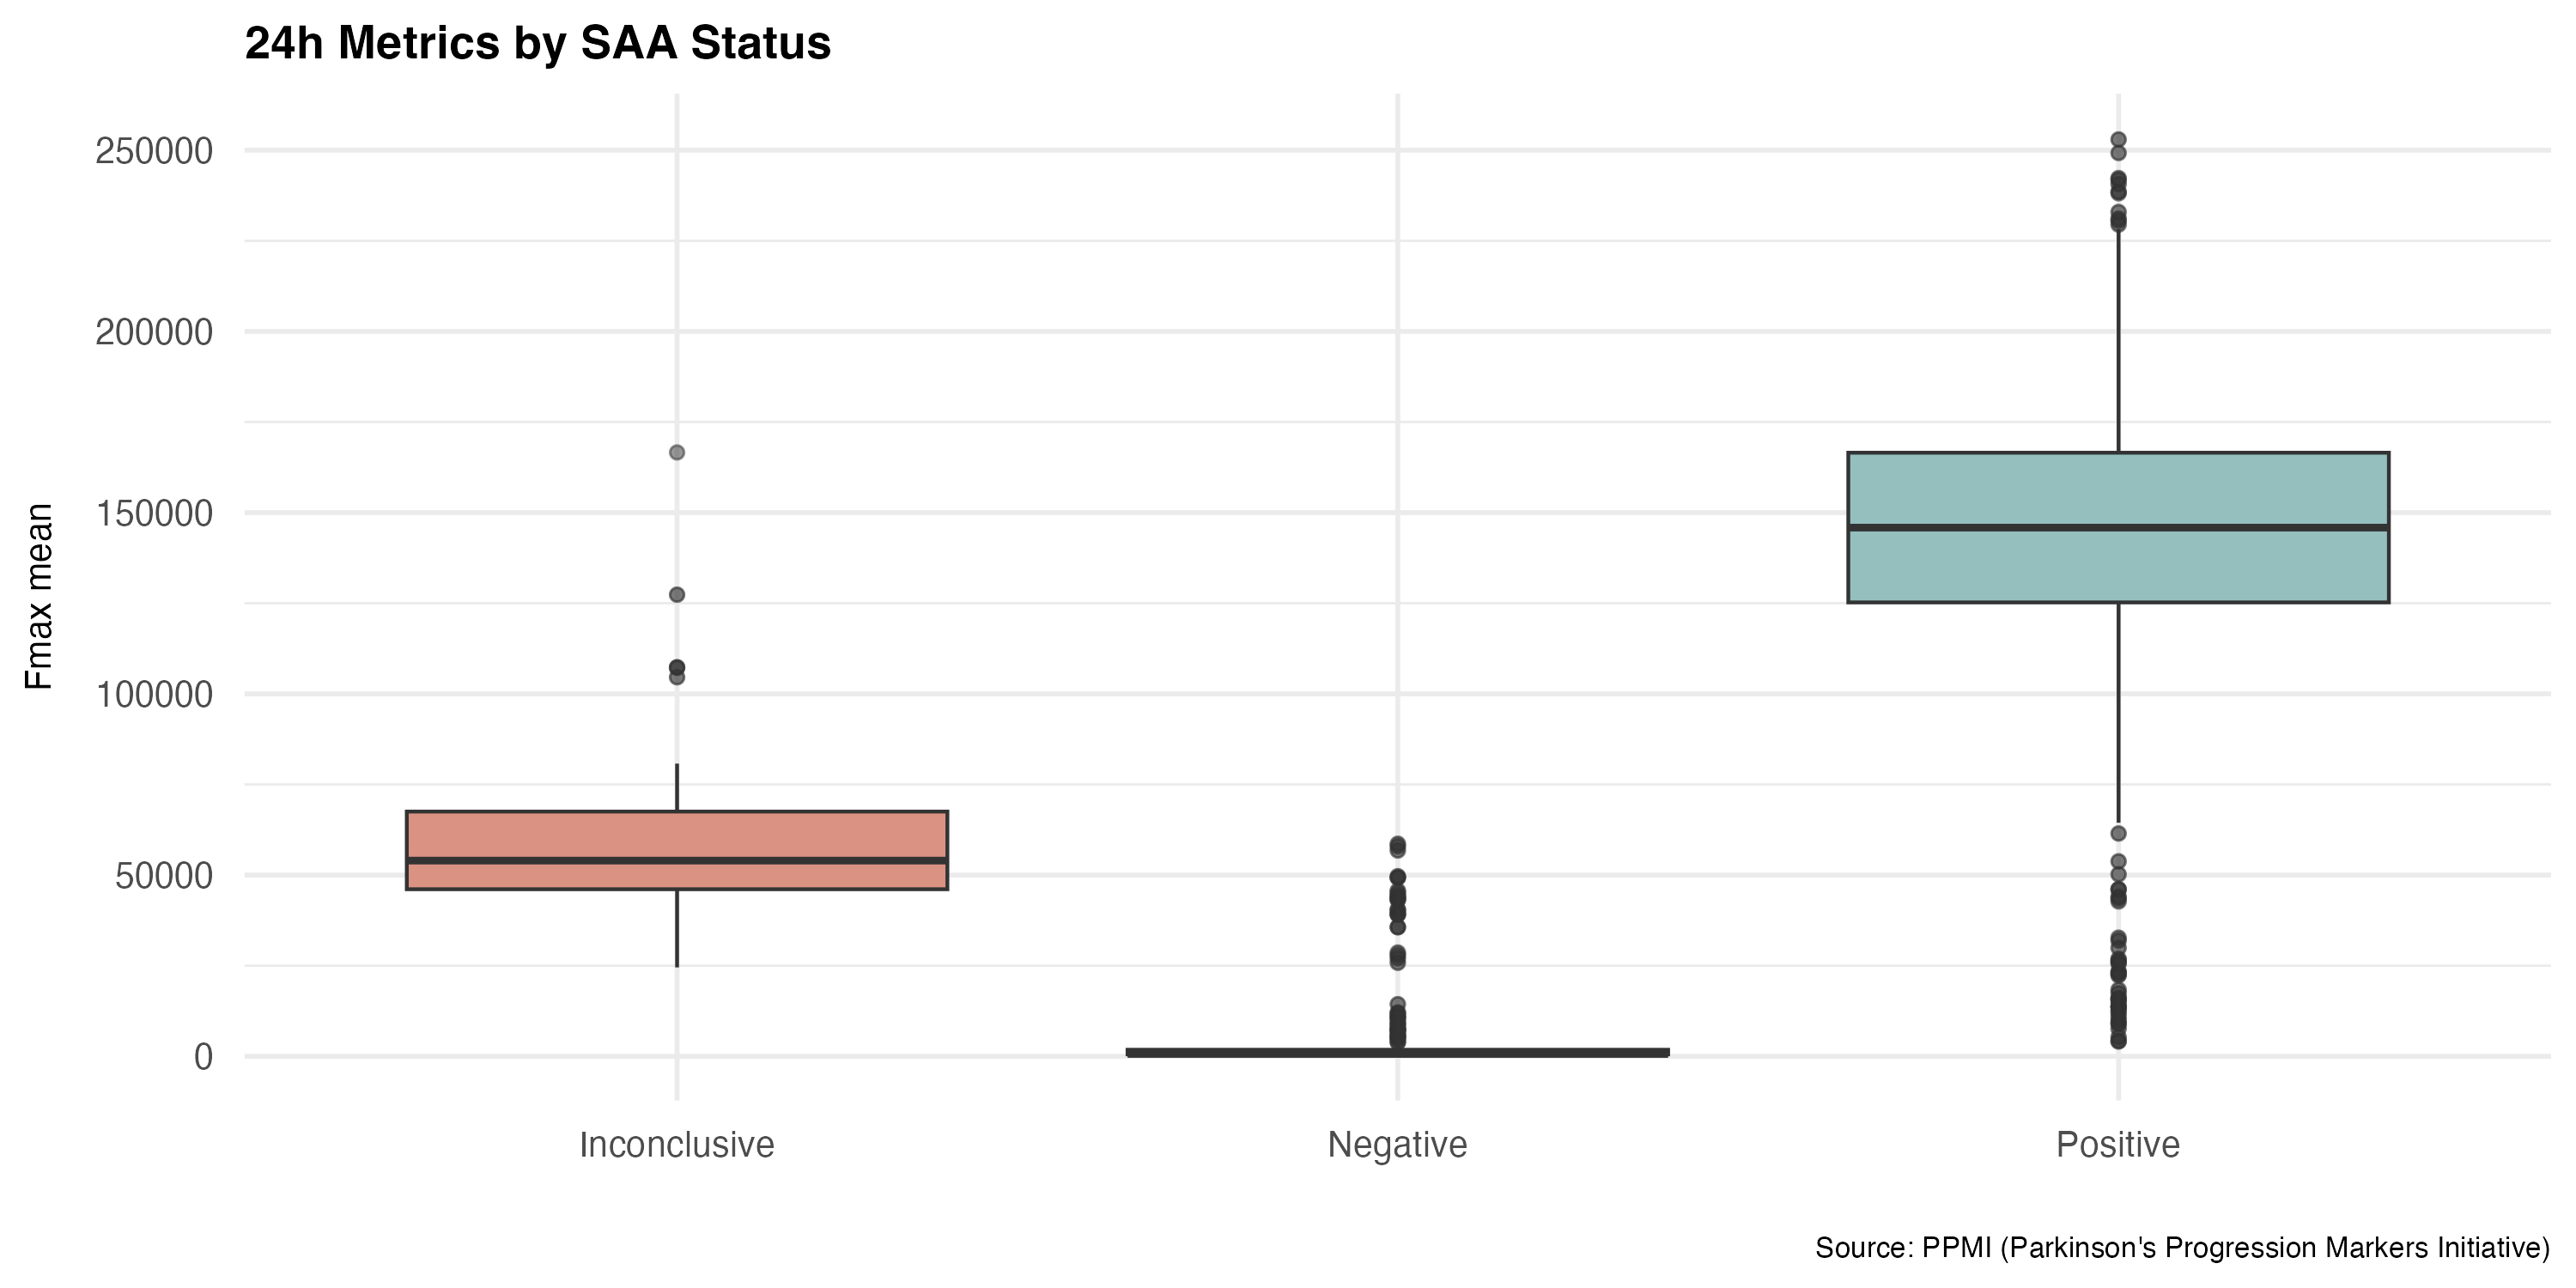
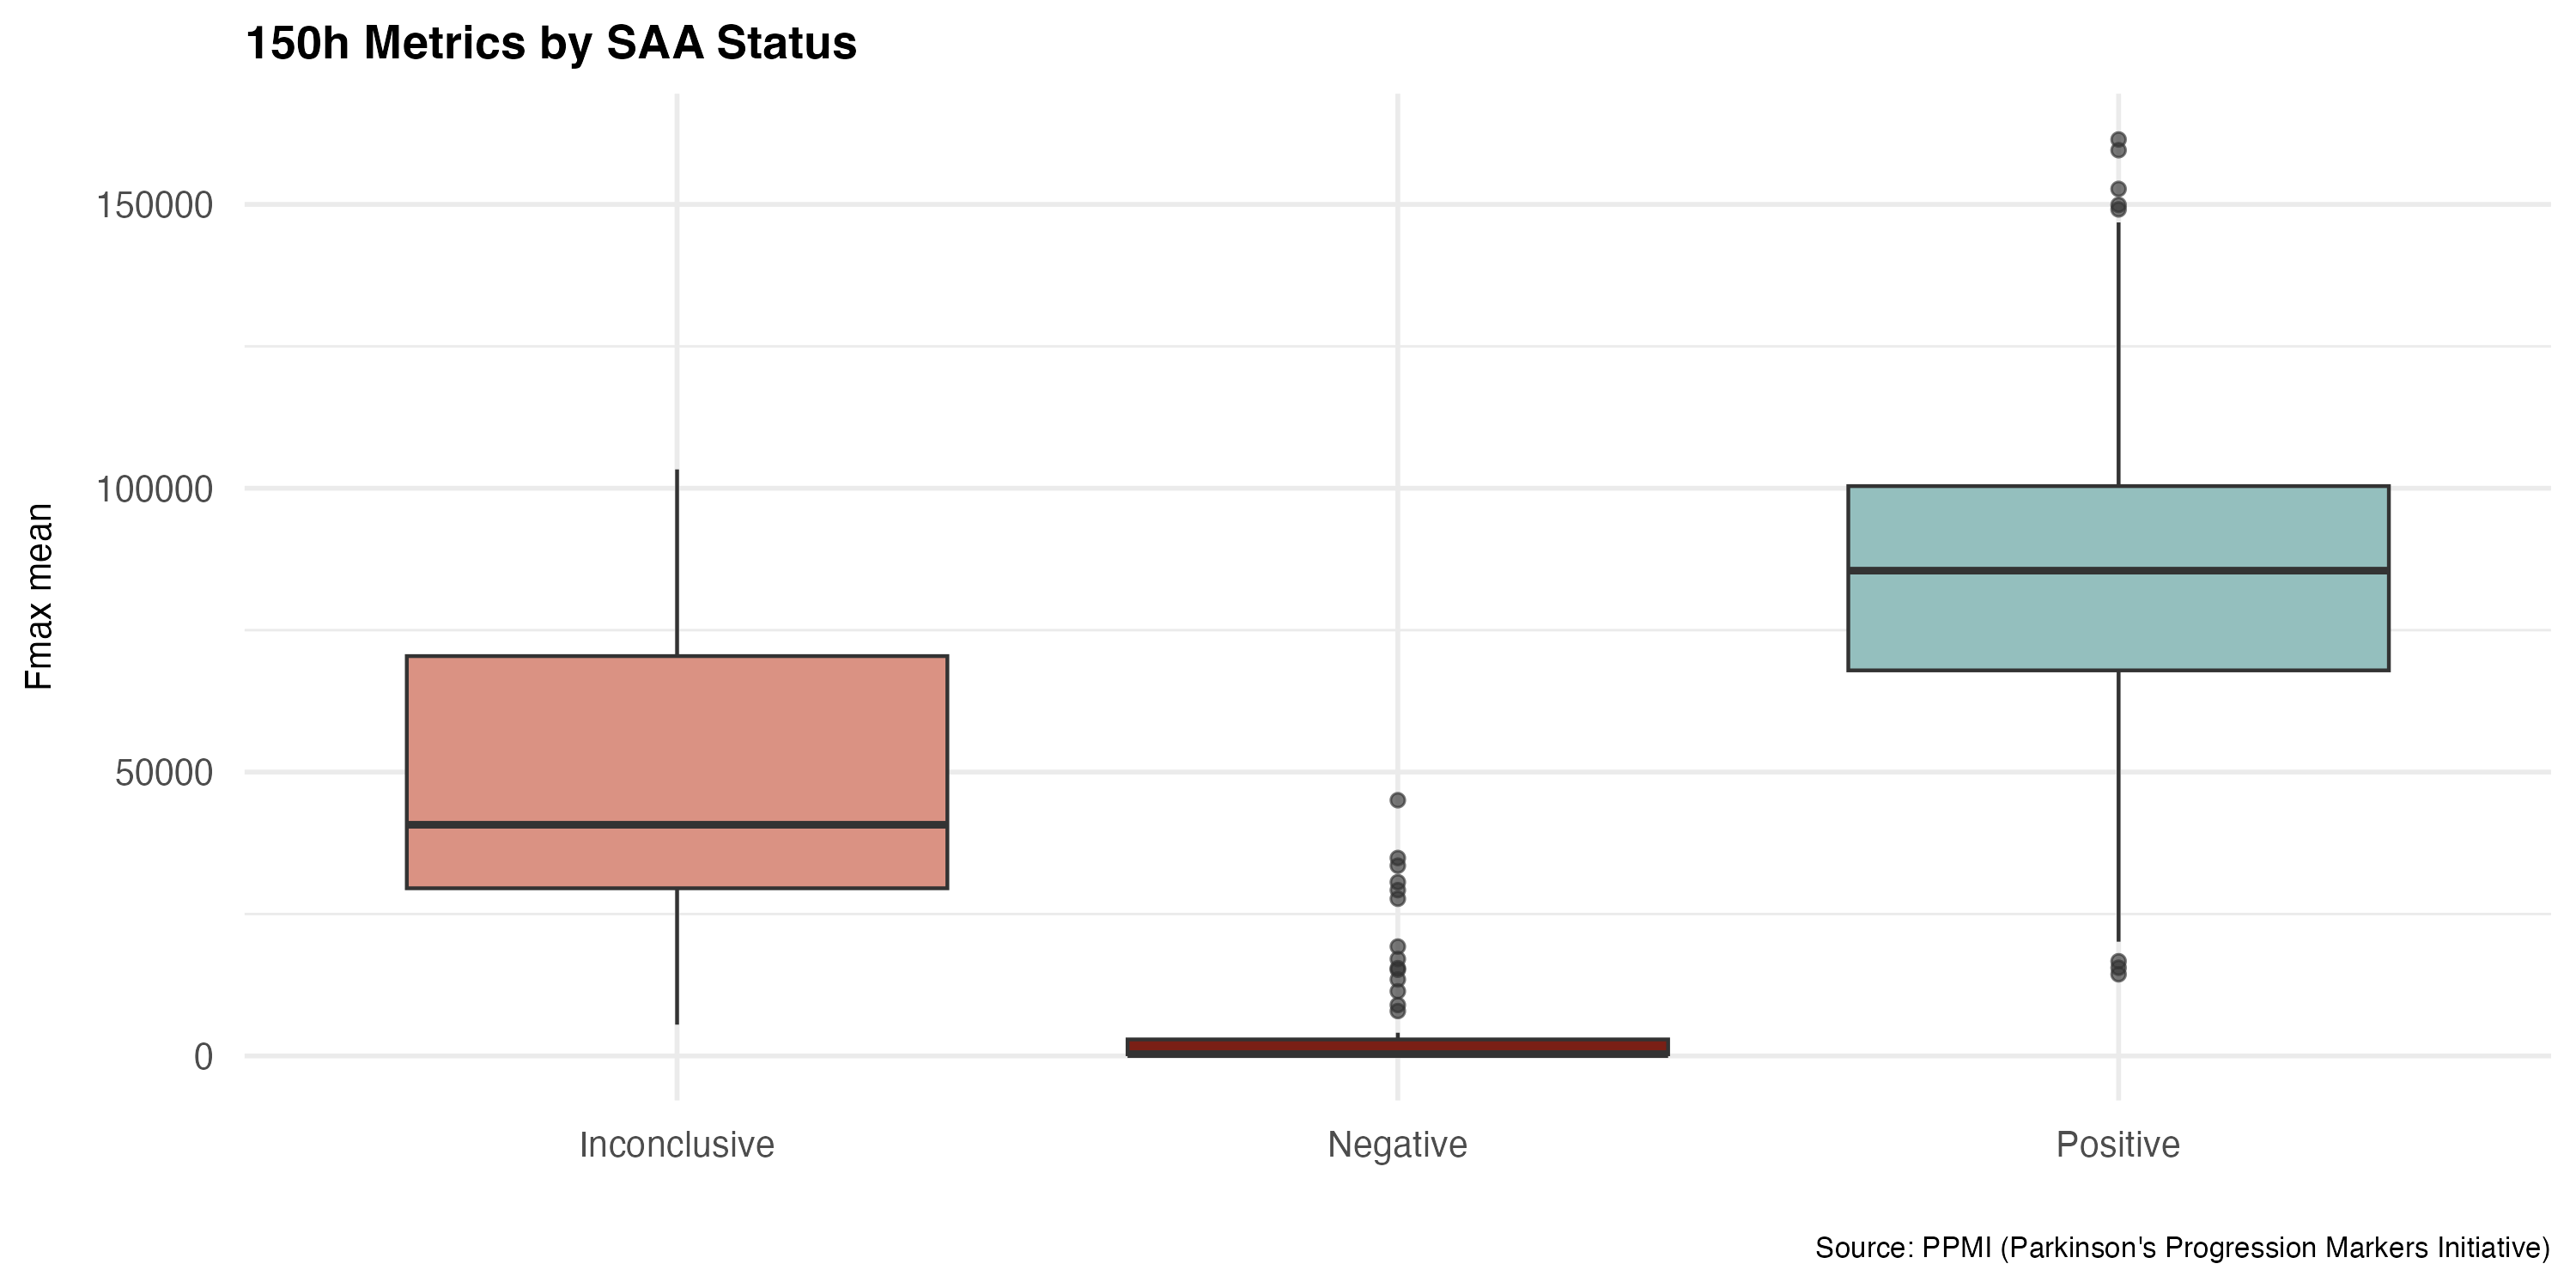
Alternative diagnostic variables
Fmax_mean
Statistically significant difference in both 24h and 150h SAA
AUC, SLOPE, T50 and TTT
Inconsistencies in the two projects (replicates)
- Can standard deviations in replicates say something about whether one project is better than the other?
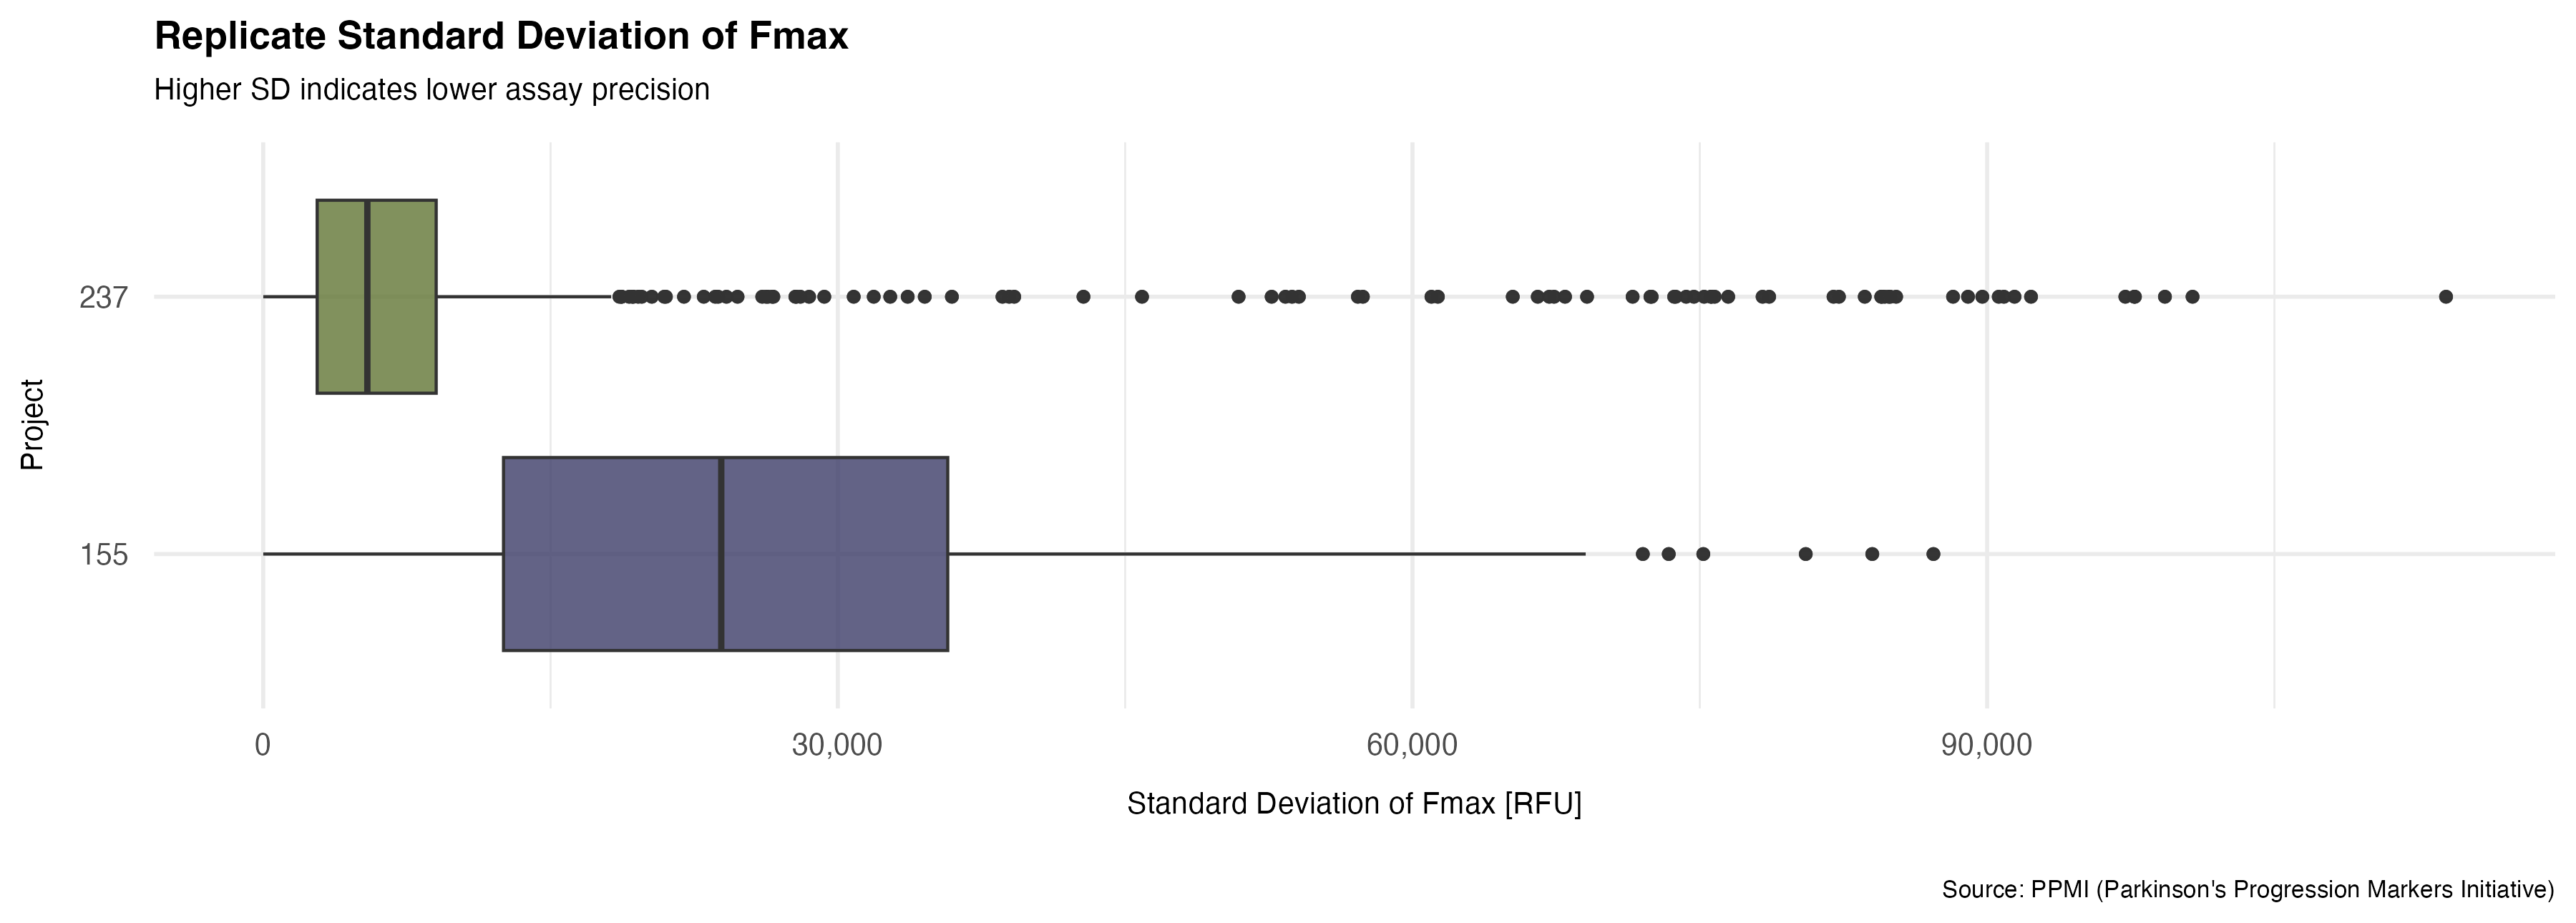
| Project | Mean SD | Median SD | IQR |
|---|---|---|---|
| 155 | 24,066 | 22,198 | 26,131 |
| 237 | 10,386 | 5,662 | 6,470 |
- Can the instruments explain some of these differences?
Mean fmax over time
Question: Does the signal become stronger further into disease progression?
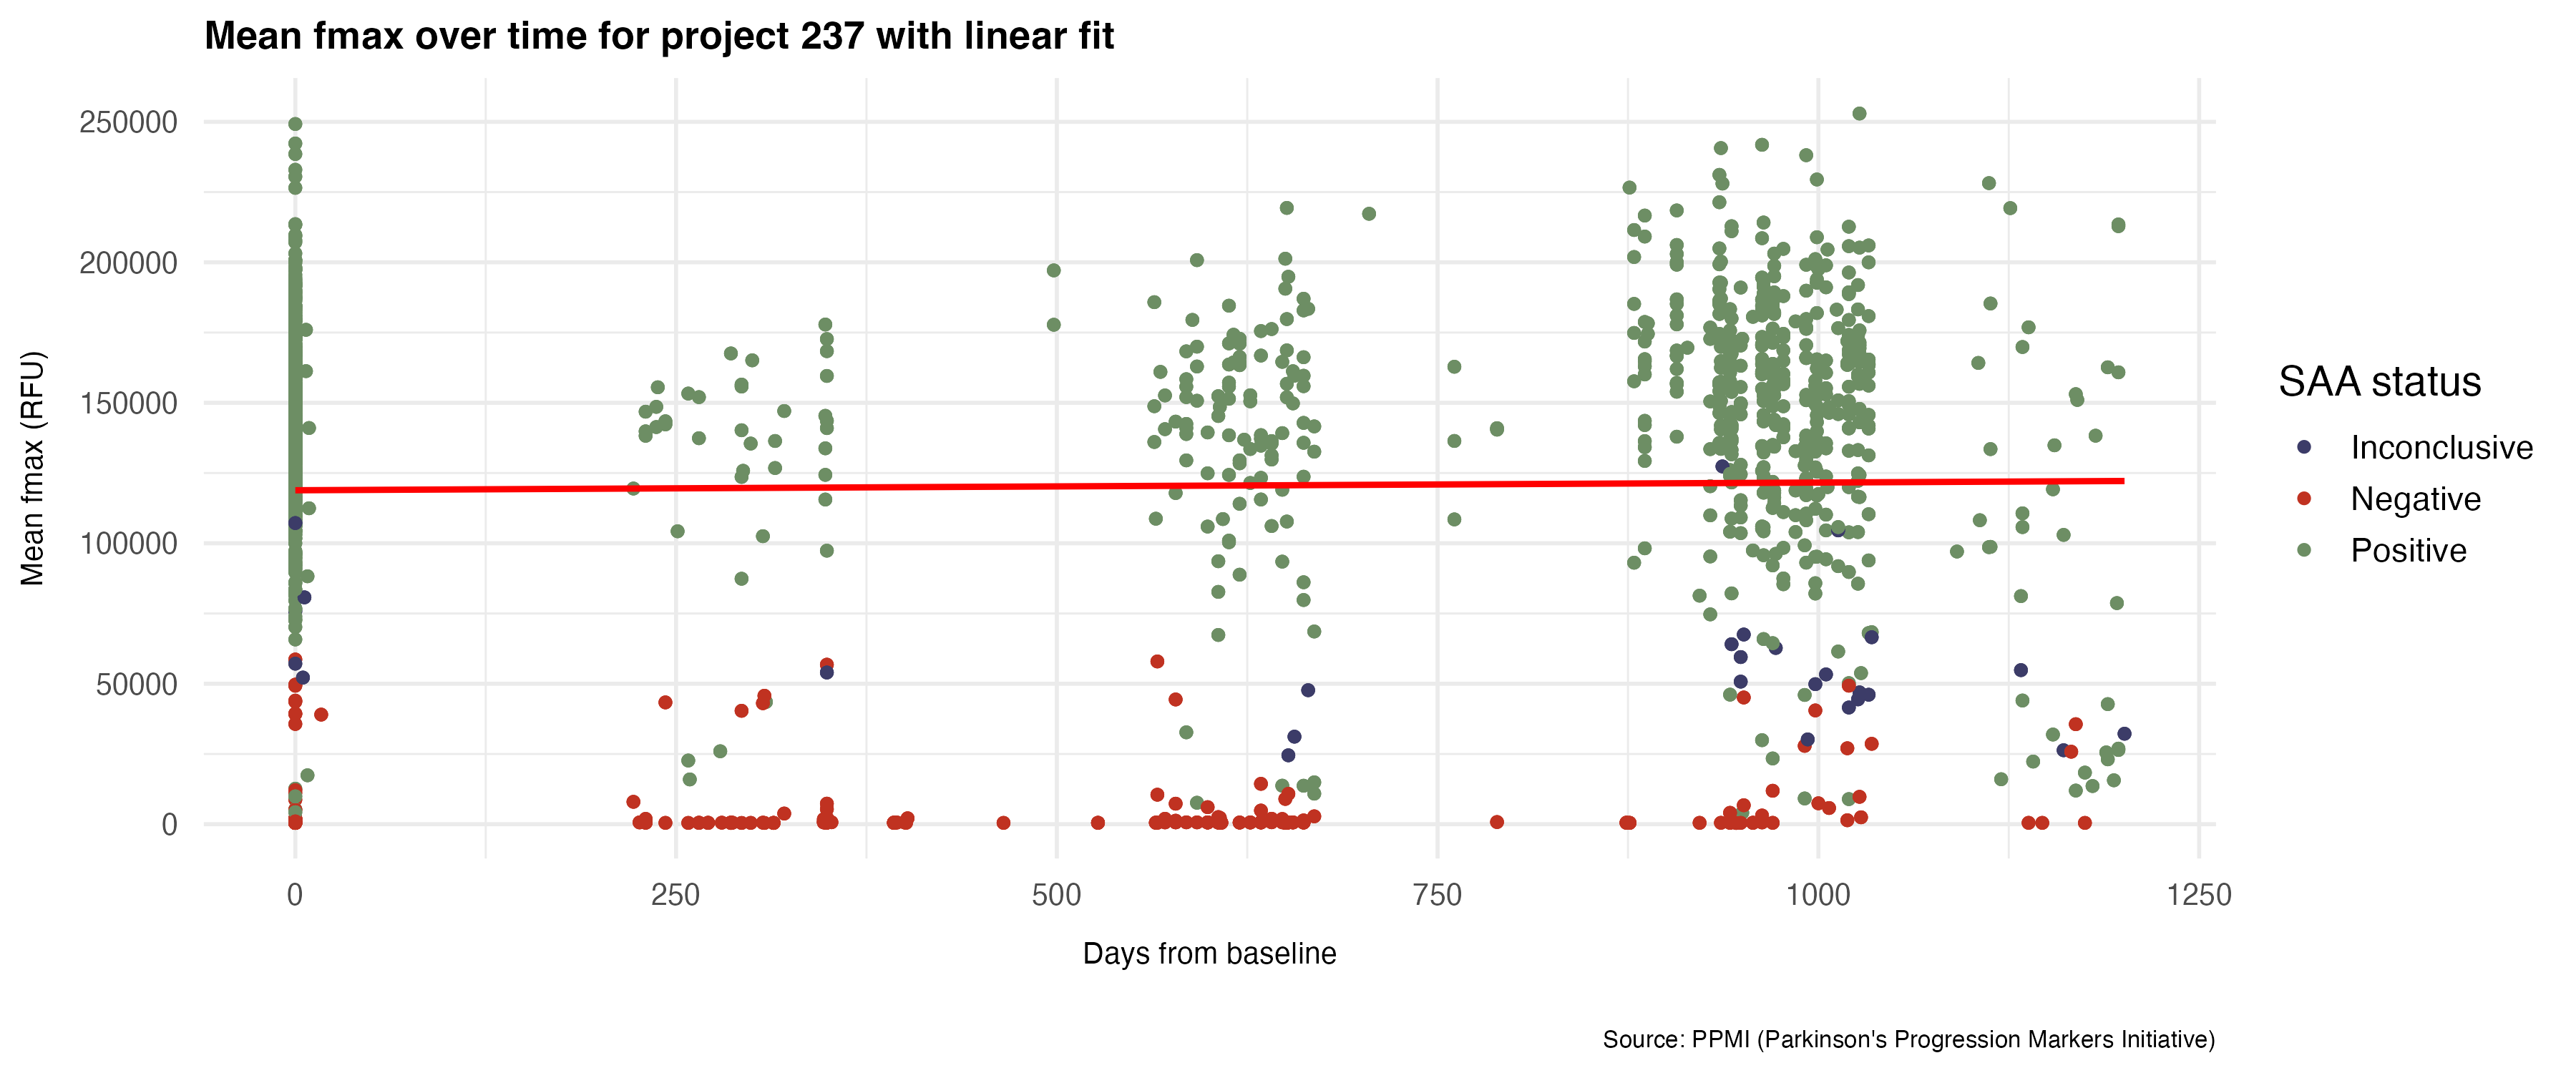
Only for project 237 above
Not necessarily comparable fmax mean values
Project 155 only had close to baseline measurements
No connection
Note: Days from baseline is a not actually a measure of disease progression…
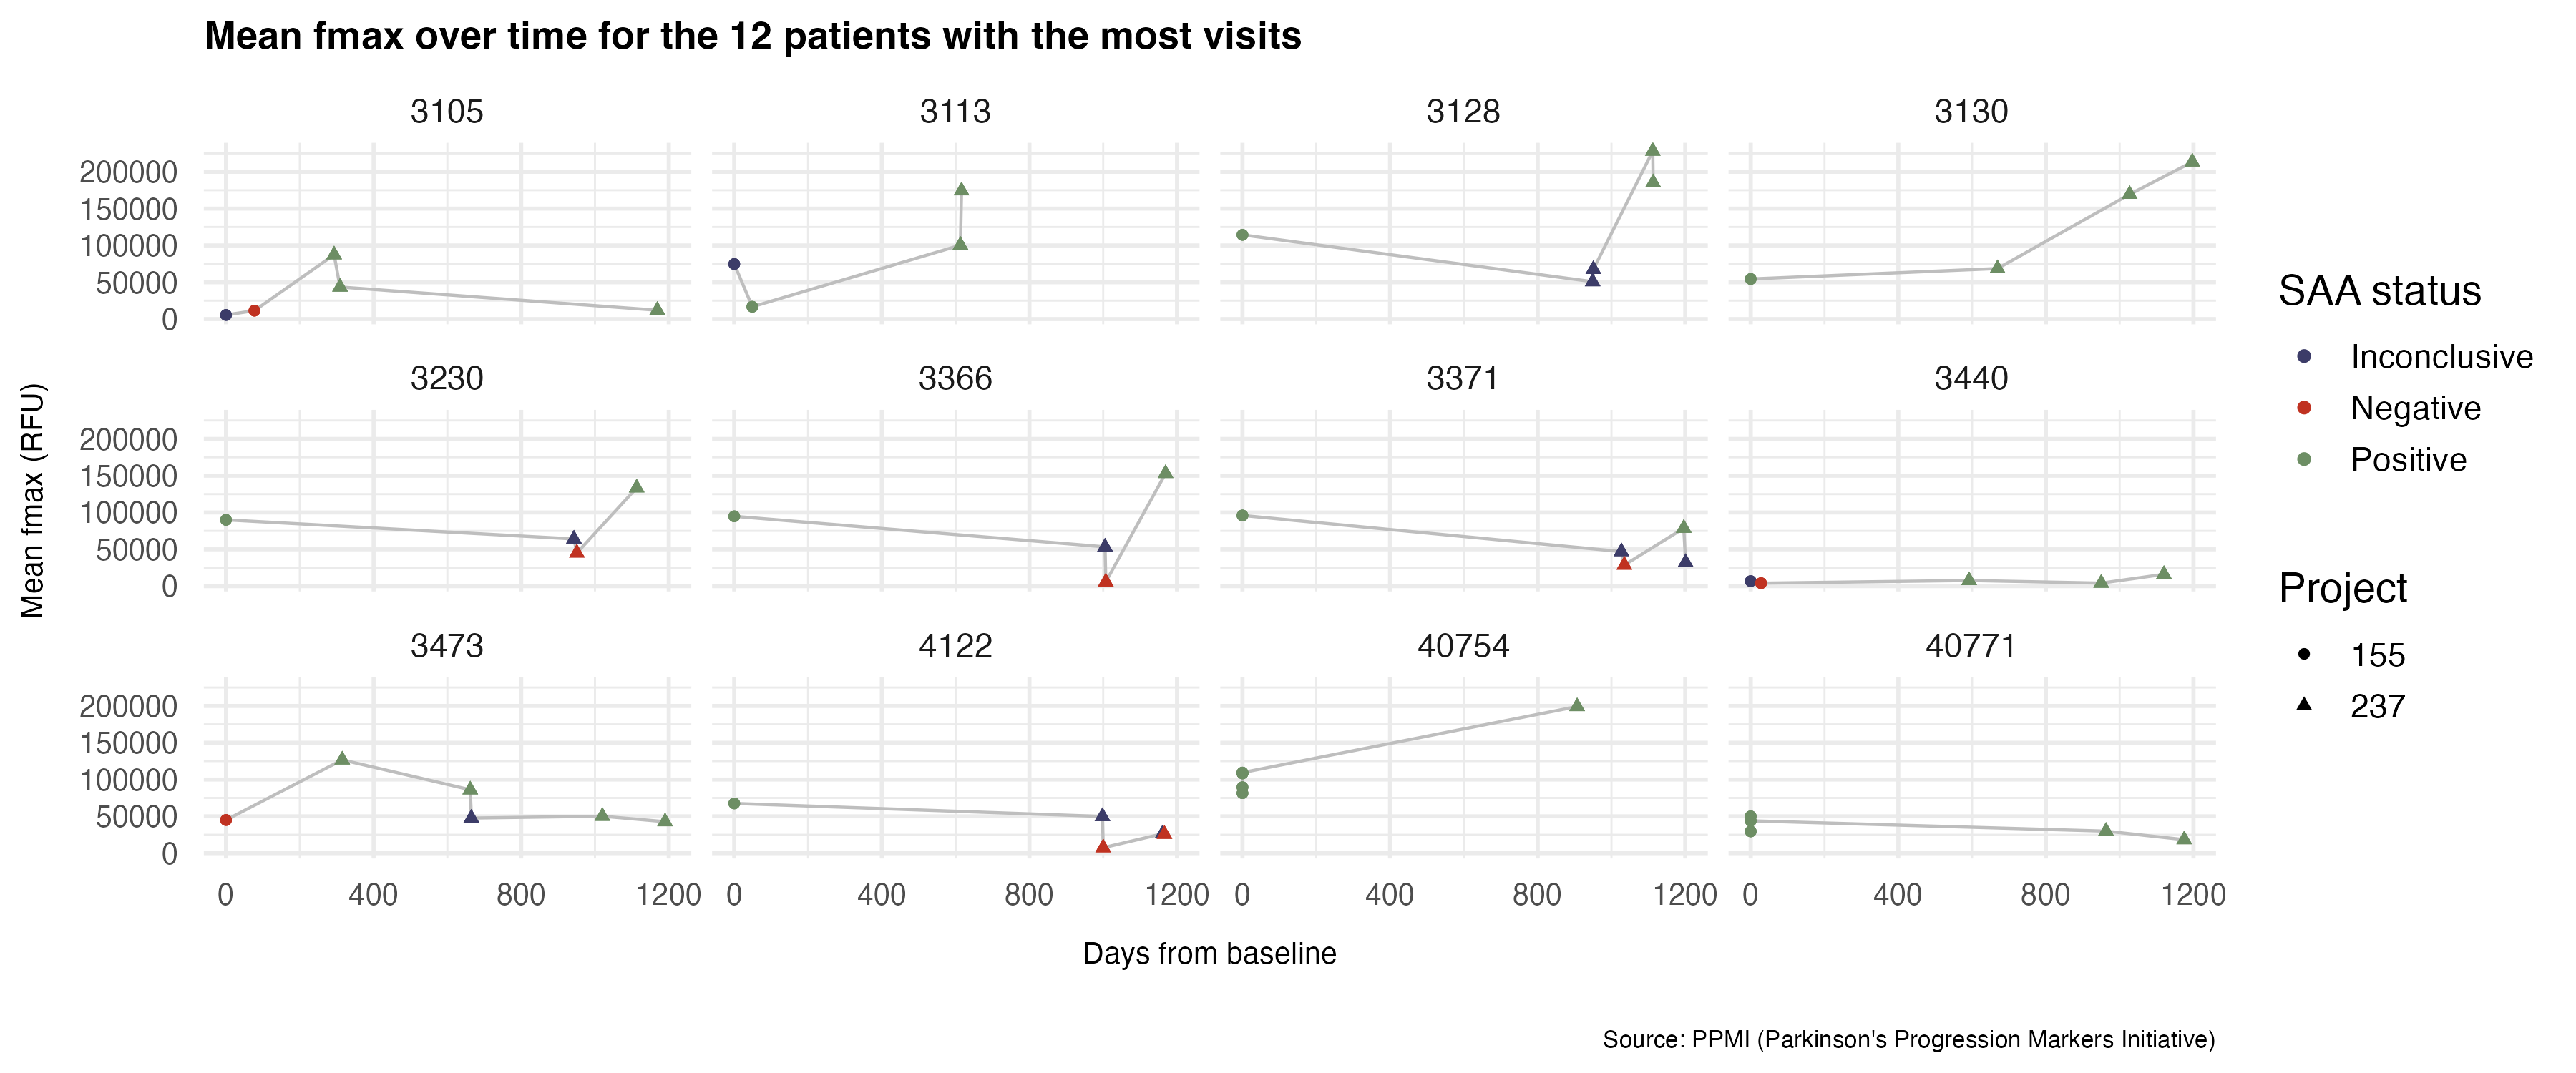
Patient variation, if any connection at all
We also looked at more patients