Shiny Applications
Creating interactive Web applications with R
Welcome back everyone! Today we will have a look at
- How to create Shiny Apps in R
- What to look out for when creating Dashboards
Shiny Applications in R 💎
What is Shiny?
Shiny is an R package that makes it easy to build interactive web
applications (apps) straight from R. You need to install the package
shiny:
For a quick illustration of what you can do with Shiny head over to the interactive visualisation tool for the Freedom of Press Index
Throughout the lab we will use a running example to illustrate the different aspects of creating a shiny app. You can find it in the folder “our_app”. It is interactive plot that displays all movies on Rotten Tomatoes and includes several filtering options.
Structure of a Shiny App
Shiny apps are contained in a single script called
app.R. The script app.R lives in a directory (for example,
newdir/) and the app can be run with
runApp("newdir").
app.R has three components:
A user interface object: The (UI) object controls the layout and appearance of your app.
A server function: The
serverfunction contains the instructions that your computer needs to build your app.A call to the
shinyApp()function: TheshinyApp()function creates Shiny app objects from an explicit UI/server pair.
Running a Shiny App
To create a Shiny app you need to create a new directory and save an
app.R file inside it. This app.R script needs
to contain the three components outlined above. Further, it is
recommended that each app should have its own unique directory.
You can run a Shiny app by giving the name of this directory to the
function runApp(). For example if your Shiny app is in a
directory called my_shiny_app, run it with the following
code:
Layout / UI 🗺
Shiny uses the function fluidPage() to create a display
that automatically adjusts to the dimensions of your user’s browser
window. You lay out the user interface of your app by placing elements
in the fluidPage() function. Alternatives to
fluidPage() exist (i.e. fixedPage(),
bootstrapPage()), but these are only useful in specific
situations.
For example, the ui function below creates a user
interface that has a title panel and a sidebar layout, which includes a
sidebar panel and a main panel. Note that these elements are placed
within the fluidPage() function.
ui <- fluidPage(
  titlePanel("title panel"),

  sidebarLayout(
    sidebarPanel("sidebar panel"),
    mainPanel("main panel")
  )
)
While titlePanel() and sidebarLayout()
create a basic layout for your Shiny app, you can also create more
advanced layouts. For example you can use navbarPage() to
give your app a multi-page user interface that includes a navigation
bar. Or you can use fluidRow() and column() to
build your layout up from a grid system. If you’d like to learn more
about these advanced options, have a look at the Shiny
Application Layout Guide.
Within the different layout functions you can also customise your app further by italisising or making your font bold and even including html elements:
To include images you need to use the img function.
img(src = "my_image.png", height = 72, width = 72)

# "src =" needs to be typed out since the html expects it.
To learn more about how you can customise your UI see here and here.
Widgets 🐭
A widget is a web element that your users can interact with. In other words to make your app interactive, you need widgets. These provide a way for your users to send messages to the Shiny app, meaning that when a user changes the input in a widget, the value that is shown will change as well.
Shiny comes with a family of pre-built widgets, each created with a
transparently named R function. For example, Shiny provides a function
named actionButton() that creates an Action Button and a
function named sliderInput that creates a slider bar.
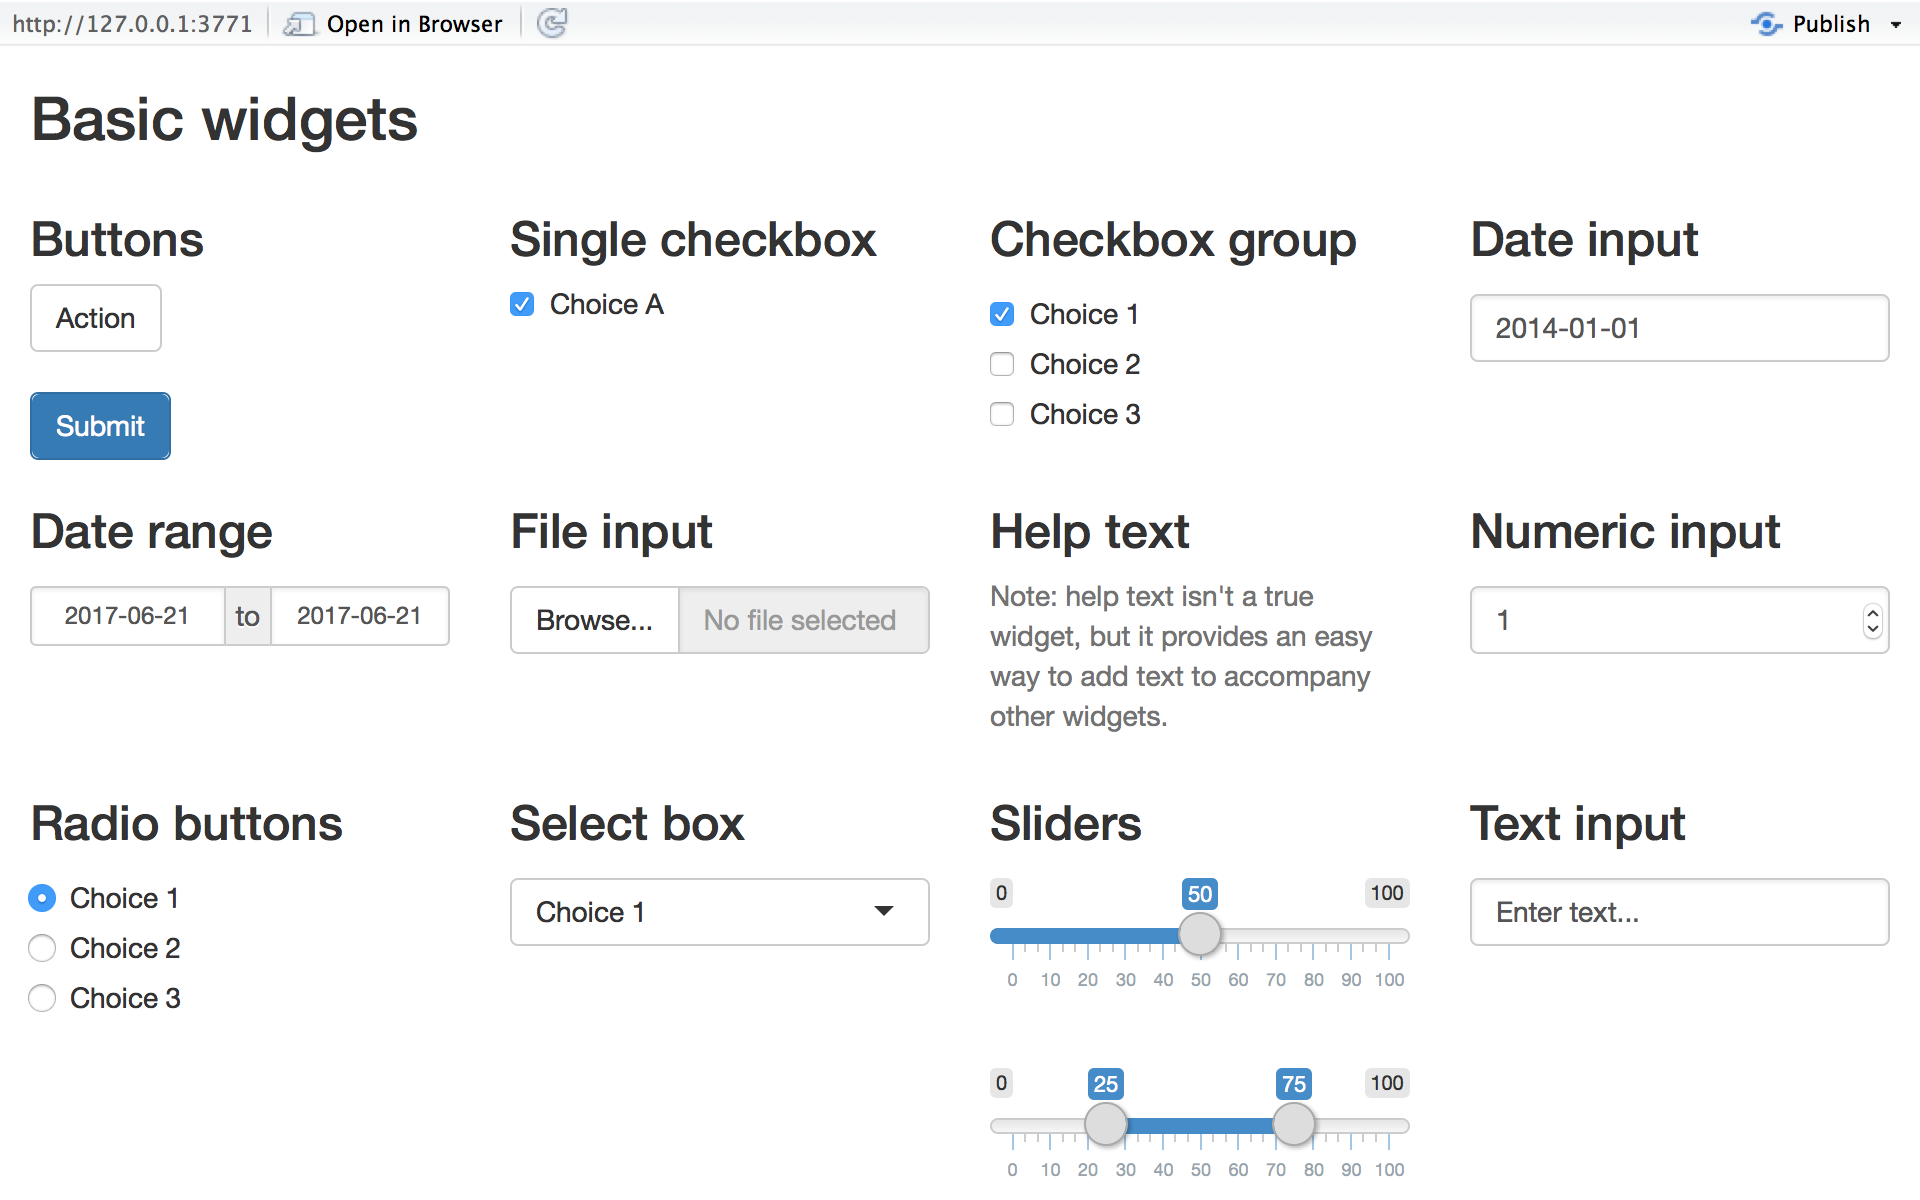
Check out the gallery for an overview of standard widgets:
To add a widget to your app, you need to include a widget function in
sidebarPanel() or mainPanel() in your
ui object.
Each widget function requires several arguments. The first two arguments for each widget are:
A name for the widget: The user will not see this name, but you can use it to access the widget’s value. The name should be a character string.
A label: This label will appear with the widget in your app. It should be a character string, but it can be an empty string
"".
The remaining arguments vary from widget to widget, depending on what
the widget needs to do its job. They include things like initial values,
ranges, and increments. You can find the exact arguments needed by a
widget on the widget function’s help page, (e.g.,
?selectInput).
Relevant chunk from our running example:
fluidPage(
  titlePanel("Movie explorer"),
  fluidRow(
    column(3, ... ,
        sliderInput(name = "reviews", label = "Minimum number of reviews on Rotten Tomatoes",
          10, 300, 80, step = 10),
        ... ,
        textInput("director", "Director name contains (e.g., Miyazaki)"),
    ),
    ...,
    selectInput("xvar", "X-axis variable", axis_vars, selected = "Meter")
    )
  )
Display Reactive Output
To give your Shiny App a feeling of live interactiveness you need to include a way to display reactive output. Reactive output automatically responds when your user selects an option in a widget.
There are two steps involved in making your widgets reactive:
- Add the relevant output function to your
uifunction. - Provide R code to build the object in your
serverfunction.
Step 1
Shiny provides a family of functions that turn R objects into output for your user interface. Each function creates a specific type of output.
Some examples are: plotOutput() for reactive plots,
tableOutput() for reactive tables.
In our running example we used textOutput() to give the
number of movies displayed:
Step 2
Placing a function in ui tells Shiny where to display
your object. Next, you need to tell Shiny how to build the object.
We do this by providing the R code that builds the object in the
server function. You do this by defining a new element for
output within the server function. The element name should
match the name of the reactive element that you created in the
ui.
If you created a textOutput("selected_var") in your
ui, output$selected_var in the
server function matches this.
To illustrate this, let’s look at our example, where we used
textOutput("n_movies"), in the server function
we state:
server <- function(input, output, session) {
  ... ,

  output$n_movies <- renderText({ nrow(movies()) })
}

# Note that movies is a df that we create within our server function
Every output* function in ui, has a
corresponding render* function in server for building
reactive widgets.
Each render* function takes a single argument: an R
expression surrounded by braces, {}. The expression can be
one simple line of text, or it can involve many lines of code, as though
it were a complicated function call.
More complicated examples ⚙️
You can create more complicated Shiny apps by loading R Scripts, packages, and data sets.
What you need to know is that:
- The directory that
app.Rappears in will become the working directory of the Shiny app - Shiny will run code placed at the start of
app.R, before theserverfunction, only once during the life of the app. - Shiny will run code placed inside
serverfunction multiple times, which can slow down the app.
In our example, this is used to first create and join the necessary
tables for the entirety of the app. This only needs to be done once.
Within the server function we then filter and select based
on certain inputs; obviously this needs to be repeated every time the
input changes. This is why we placed that code within the
server function.
Exercises
Now it is your turn, adapt the Shiny app by:
- Adding a widget that let’s you subset by the film’s genre:
- Think about where you specify this?
- Make sure to specify what the default option should be.
- Genre Categories in the data include: Action, Adventure, Animation, Biography, Comedy, Crime, Documentary, Drama, Family, Fantasy, History, Horror, Music, Musical, Mystery, Romance, Sci-Fi, Short, Sport, Thriller, War, Western.
- Turn our scatter plot into a bubble plot, where the size of the bubbles is determined by the revenues generated at the Box-Office.
Guidelines for Dashboards 🖌
Now that you have the tools to create interactive dashboards, you might be eager to use these skills liberally. And so you should. But, dashboards are not always the best way to visualise data. Prior to developing a dashboard you should make sure to ask yourself a few questions.
Checklist before you start ✅
- Are you tackling a monitoring task that needs your data/metrics to be updated frequently?
- Who will use the dashboard and to what end? What questions will they use it to answer? What actions will they take in response to these answers?
- What specific information should be displayed, and is it meaningful without much context?
- What could lead to the metrics being wrong/misleading?
If a dashboard still sounds like the best approach after considering these questions, go for it!
Design advice
Even then, there are a number of design guidelines that you should follow. Here is a non-exhaustive list:
- Minimize distractions.
- Focus on meaningful quantities of interest, not the ones that look cool.
- Don’t overload with information.
- Apply all rules of good data visualisation.
- Use interactive figures with care (e.g., to make optional content conditionally visible)
- Try not to exceed the boundaries of a single screen.
- Ensure desktop/mobile screen responsiveness
(
fluidPage(), will achieve this).
Dashboards with flexdashboard
The goal of flexdashboard is to make it easy to create interactive dashboards for R, using R Markdown. A flexdashboard can either be static (a standard web page) or dynamic (a Shiny interactive document). A wide variety of components can be included in flexdashboard layouts, for a full list see the documentation.
As with Shiny apps, it is difficult to interactively present an
example in a script. Therefore, we are going to be working with the
example in the folder /felxdash. It is an example of a
flexdashboard created by Kyle
Walker. For a rendered version of the dashboard click
here.
Flexdashboard in practice 🏀
The big difference to Shiny apps is that the flexdashboard Rmd will
take over the function used to define the layout of the dashboard/app.
In other words, the entire Rmd, now plays the role of
fluidPage().
So let’s have a closer look at how you can structure a flexdashboard.
Columns and rows
Dashboards are divided into columns and rows, with output components
delineated using level 3 markdown headers (###). By
default, dashboards are laid out within a single column, with charts
stacked vertically within a column and sized to fill available browser
height.
If you want to change the dashboard to include multiple columns you
can introduce the following (--------------).
If you want to change the dashboard to include multiple tabs you can
introduce the following (=============).
In the YAML tab of the Rmd you can specify a number of additional properties:
vertical_layout: scrollorientation: rows
Feeling overwhelmed? No need to come up with a fancy design all on your own. You can find a long list of templates here.
A note on shiny dashboards
To add Shiny components to a flexdashboard there are a few things that you need to remember.
you need to add
runtime: shinyto the options declared at the top of the document (YAML front matter).Add the
{.sidebar}attribute to the first column of the dashboard to make it a host for Shiny input controls (note this step isn’t strictly required, but many Shiny based dashboards will want to do this).
Overall, however, the same rules apply:
- You should perform any expensive loading of data within the global chunk.
- Input elements will go into the
{.sidebar}column. - Outputs are represented within flexdashboard content panes
Now you are more or less ready to go!
Display all your new skills? 😁
Thinking a bit ahead (e.g. data science / academic job market), one way to go would be to create a personalized website as a central source to everything you would like to show. What to include, of course, highly depends on your profile, your discipline and the job market you are interested in.
For an academic webpage that could for example be:
- about statement
- CV
- list of publications / working papers
- list of course materials for courses that you’ve taught
- example of data science project / app / package you’re proud of
- contact + links to Github, Google Scholar, Twitter, etc.
Here is a recommendation by Elsevier on how to create effective academic personal website.
For a non-academic webpage (e.g. focus on industry jobs) that could be:
- about statement
- CV (?)
- EXAMPLES of data science projects
- contact + links to Github, LinkedIn, etc.
Usually, a good first step is to look at webpages of other people with similar profiles you find inspiring (e.g. people that already have the job you’d like to have). 👀
Tools to build personal webpages
There is a plethora of possibilities to build your personal webpage, from very basic to very very complicated.
Very simple point-and-click ways to create websites are Google Sites, WordPress, Wix, etc. However, the free versions often come with ads and other downsides.
GitHub Pages 🐙
One mid-range way that we’d recommend (it requires some coding experience, but you have that!) is to use GitHub Pages because
- it’s free and free of ads
- the page is directly hosted from your GitHub repository
- you can choose from a huge variety of Jekyll themes
- it compiles HTML from Markdown - something you’ve been doing all the time in this course
- and there are even more advantages
For example Rob Williams created a great tutorial on how to build an academic websites with Github; and the academicpages template is a ready-to-fork GitHub Pages template and is easily customizable (e.g., lfoswald.github.io). If you like, you can also configure custom URLs.
Here is a possibly even more accessible, multifaceted, and less complicated Quick Start tutorial on GitHub Pages.
Blogdown
Blogdown is an R package based on Hugo, another static site generator.
- it’s free
- you have great online support because you work with R and GitHub
- and you can choose from a wide range of Hugo themes
Here is a tutorial by Andrew Hetherington on how to build a data-science personal website in R using blogdown. His personal webpage is also created with blogdown. You can deploy and host your website on Netlify.
Sources
The Shiny tutorial leans heavily on RStudio’s series of written shiny tutorials. The running example of the shiny.app was adapted from: Movies-Explorer Interactive App, while the running example of the flexdashboard was adapted from Locating neighbourhood diversity in the American Metropolis.
A work by Lisa Oswald & Tom Arend
Prepared for Intro to Data Science, taught by Simon Munzert