Decision Making Using Marketing Analytics
MKT 566 · Fall 2026
USC Marshall School of Business
Introduction
A little about me
- 11th year at USC (office HOH 332)
- During 2023–25, worked full-time at Amazon, first in Ad Measurement, then in Climate Pledge Friendly
- Worked closely with data scientists, research scientists, sales teams, and product managers
- Currently part-time at Airbnb as Housing Scholar
- I run the Real-Estate Analytics Lab (REAL) and its free Substack with Marco Giacoletti
Personal website: https://dadepro.github.io/.
A little about me
Research on online marketplaces and policy:
- Trust and reputation
- Platform manipulation
- Short-term rentals (Airbnb) and real estate
- Advertising
- Sports betting
My website has links to all my papers. They are also on SSRN.
A little about you
- What is your background?
- What do you expect from this class?
- Have you worked in marketing yet?
The Course
Who to contact
| Instructor | Teaching assistant | |
|---|---|---|
| Name | Davide Proserpio | Raghav Sarmukaddam |
| Office | HOH 332 | HOH 311 |
| proserpi@marshall.usc.edu | sarmukad@usc.edu | |
| Hours | Tue 2–4 pm | Thu 2:30–4:30 pm |
Both by appointment as well.
Organization
Schedule. 11:00 am – 12:20 pm, Tuesday and Thursday, in JKP 112
Class website. https://github.com/dadepro/mkt566
Syllabus. mkt566-syllabus-proserpio.pdf
Most lectures involve examples and exercises. Some classes are given over entirely to exercises, discussion, or guest speakers.
I am also planning to have a few guest speakers, very likely from tech companies.
This class is hands-on. Bring your laptop and be prepared to analyze data, write code, and present results.
Readings
Slides, plus open-source reading links provided for each topic.
Open source
- My course on data storytelling
- Data Visualization: A Practical Introduction
- R for Data Science
- R Markdown
- R for Marketing Students
Not open source (slides, exercises, and code are)
Analyzing data and coding
- I will use R and Python
- R primarily for data visualization and statistics
- Python primarily for machine learning
- For assignments you may use either, but following what I do is easier, especially if you are new to coding
IDE suggestions: VS Code (pretty much any programming language, integrates with Codex, Claude, and Copilot), RStudio (R only), Cursor.
Setup
Before the next class, install:
- R and/or Python (Python ships with macOS): install R
- An IDE or editor
- RStudio for R
- VS Code for essentially any language, including R and Python
- An AI coding tool, whichever you prefer: Claude Code, Codex, GitHub Copilot, or Cursor
Never installed a coding tool before? Follow the step-by-step VS Code + AI assistant setup guide, then the Running R Code in VS Code guide.
Optional: course materials live on GitHub, so skim git - the simple guide and the GitHub quickstart, or use the point-and-click GitHub Desktop app.
If this is the first time you have heard any of these terms, raise your hand and ask questions.
Use of AI (LLMs)
I expect you to use AI in this class. Learning to use it is an emerging skill. Keep the following in mind:
- AI is permitted to help you brainstorm topics or revise work you have already written
- Minimum-effort prompts produce low-quality results. Refining prompts to get good outcomes takes work
- Proceed with caution: do not assume the output is accurate or trustworthy
Hallucinations and mistakes are very common.
For transparency, every student submits a log of the LLM prompts used on each assignment.
Why this course matters
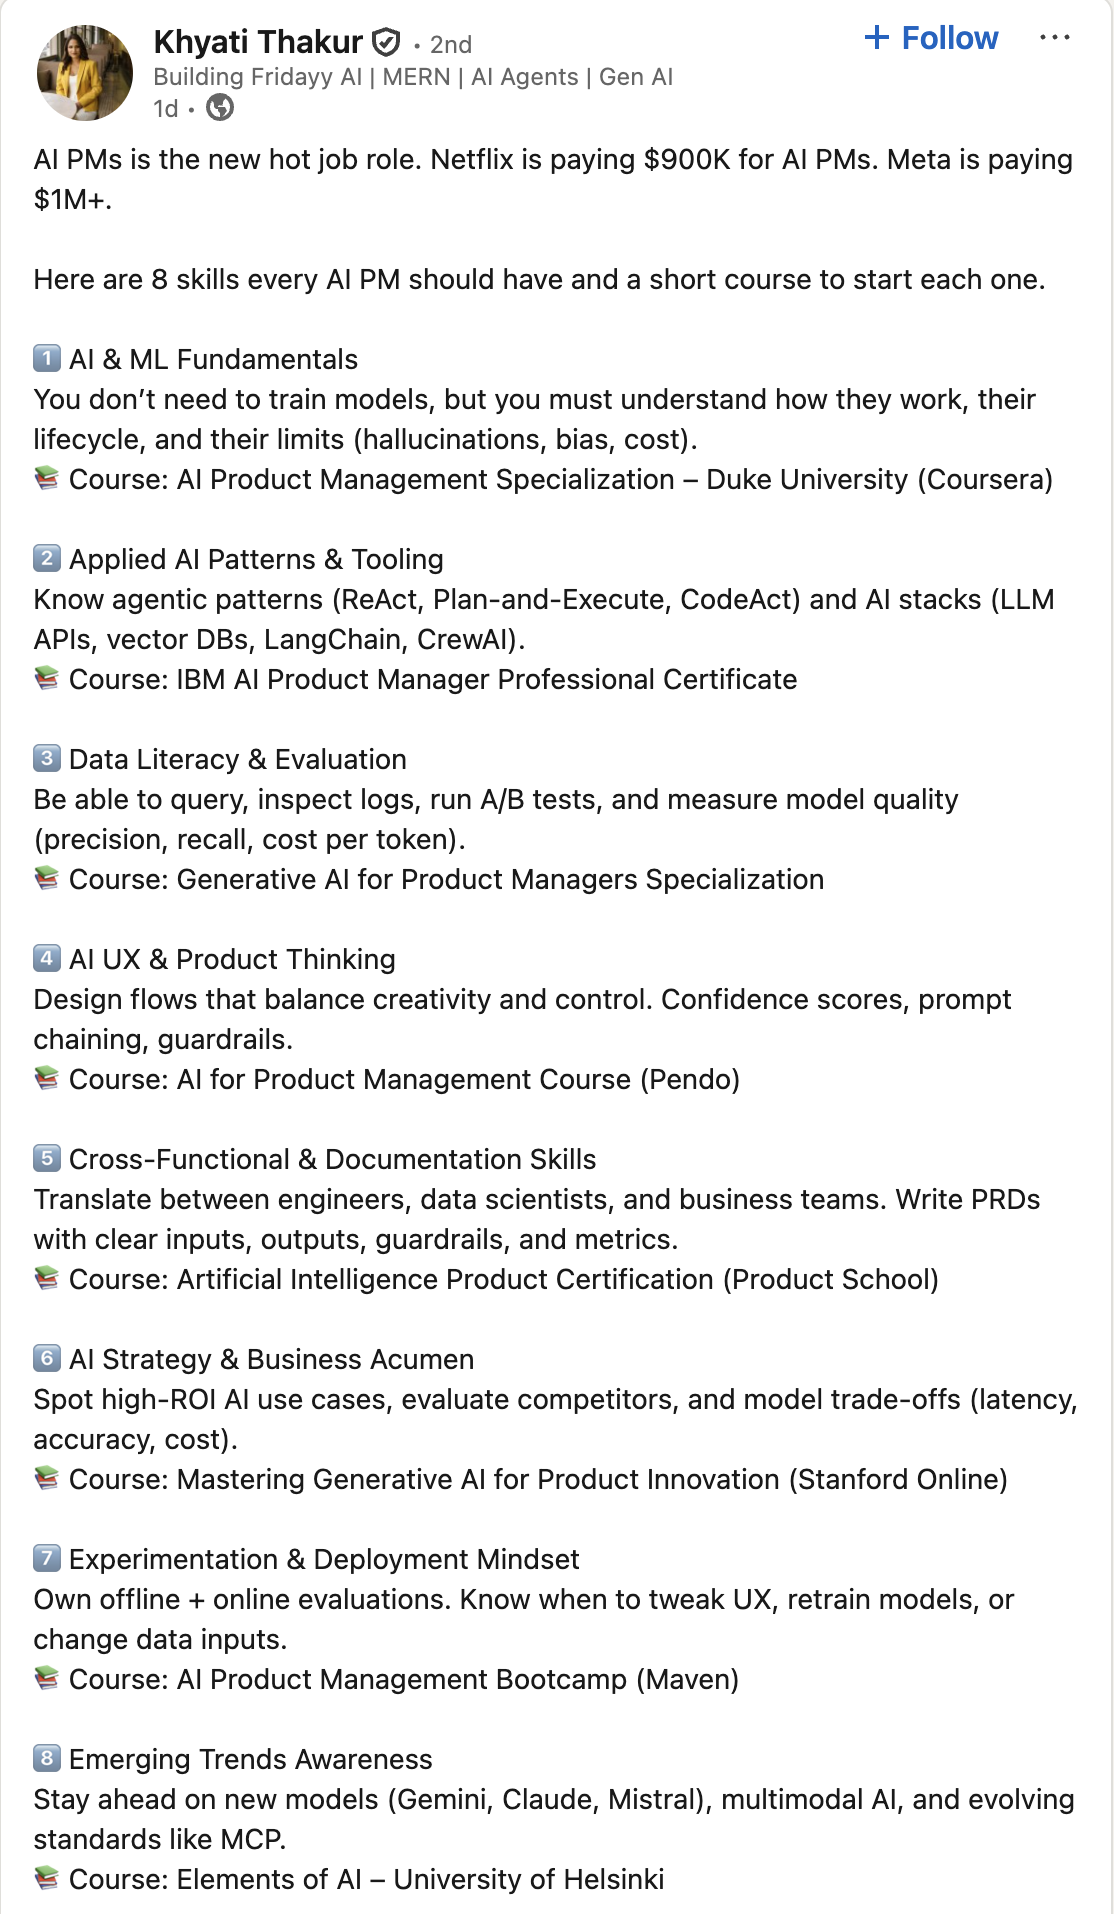
Why this course matters
- Budgets follow measurement: most marketing spend is now digital and measurable, so the marketers who can show what actually works are the ones who win the budget
- Hiring reflects it: analytics skills (SQL, R/Python, experiments) appear in a growing share of marketing job postings, from brand management to growth roles (we will look at the job-postings data on Thursday)
- AI raises the bar, it does not lower it: LLMs make code and analysis cheap. What stays scarce is judgment: which question to ask, whether the answer is credible, and what decision follows
That judgment is what this course trains: framing marketing questions, picking the right method, and turning analysis into decisions.
Grading
| Component | Weight |
|---|---|
| 4 individual assignments | 60% |
| Semester-long project (groups of 5–6) | 30% |
| Participation | 10% |
| Total | 100% |
No final exam. Your grade is the weighted average above.
Assignments
- 4 individual assignments, 60% of the grade
- Roughly three weeks for each
Each submission is an R (Markdown/Quarto) or Python notebook, converted to HTML or PDF, containing:
- Code, properly commented
- Outputs (figures, tables)
- Your answers to the assignment questions
- The log of LLM prompts used
Why a notebook? Reproducibility. Someone else, including future you, has to be able to re-run it and get the same output and results.
The Semester Project
What it is
Analyze a real-world dataset to answer one or more marketing questions. For example:
- Social media sentiment analysis: how brand perceptions changed over time, which content performs better
- Customer segmentation: who are our most valuable segments?
- Churn prediction and retention: which users are likely to churn next month?
An example from last year
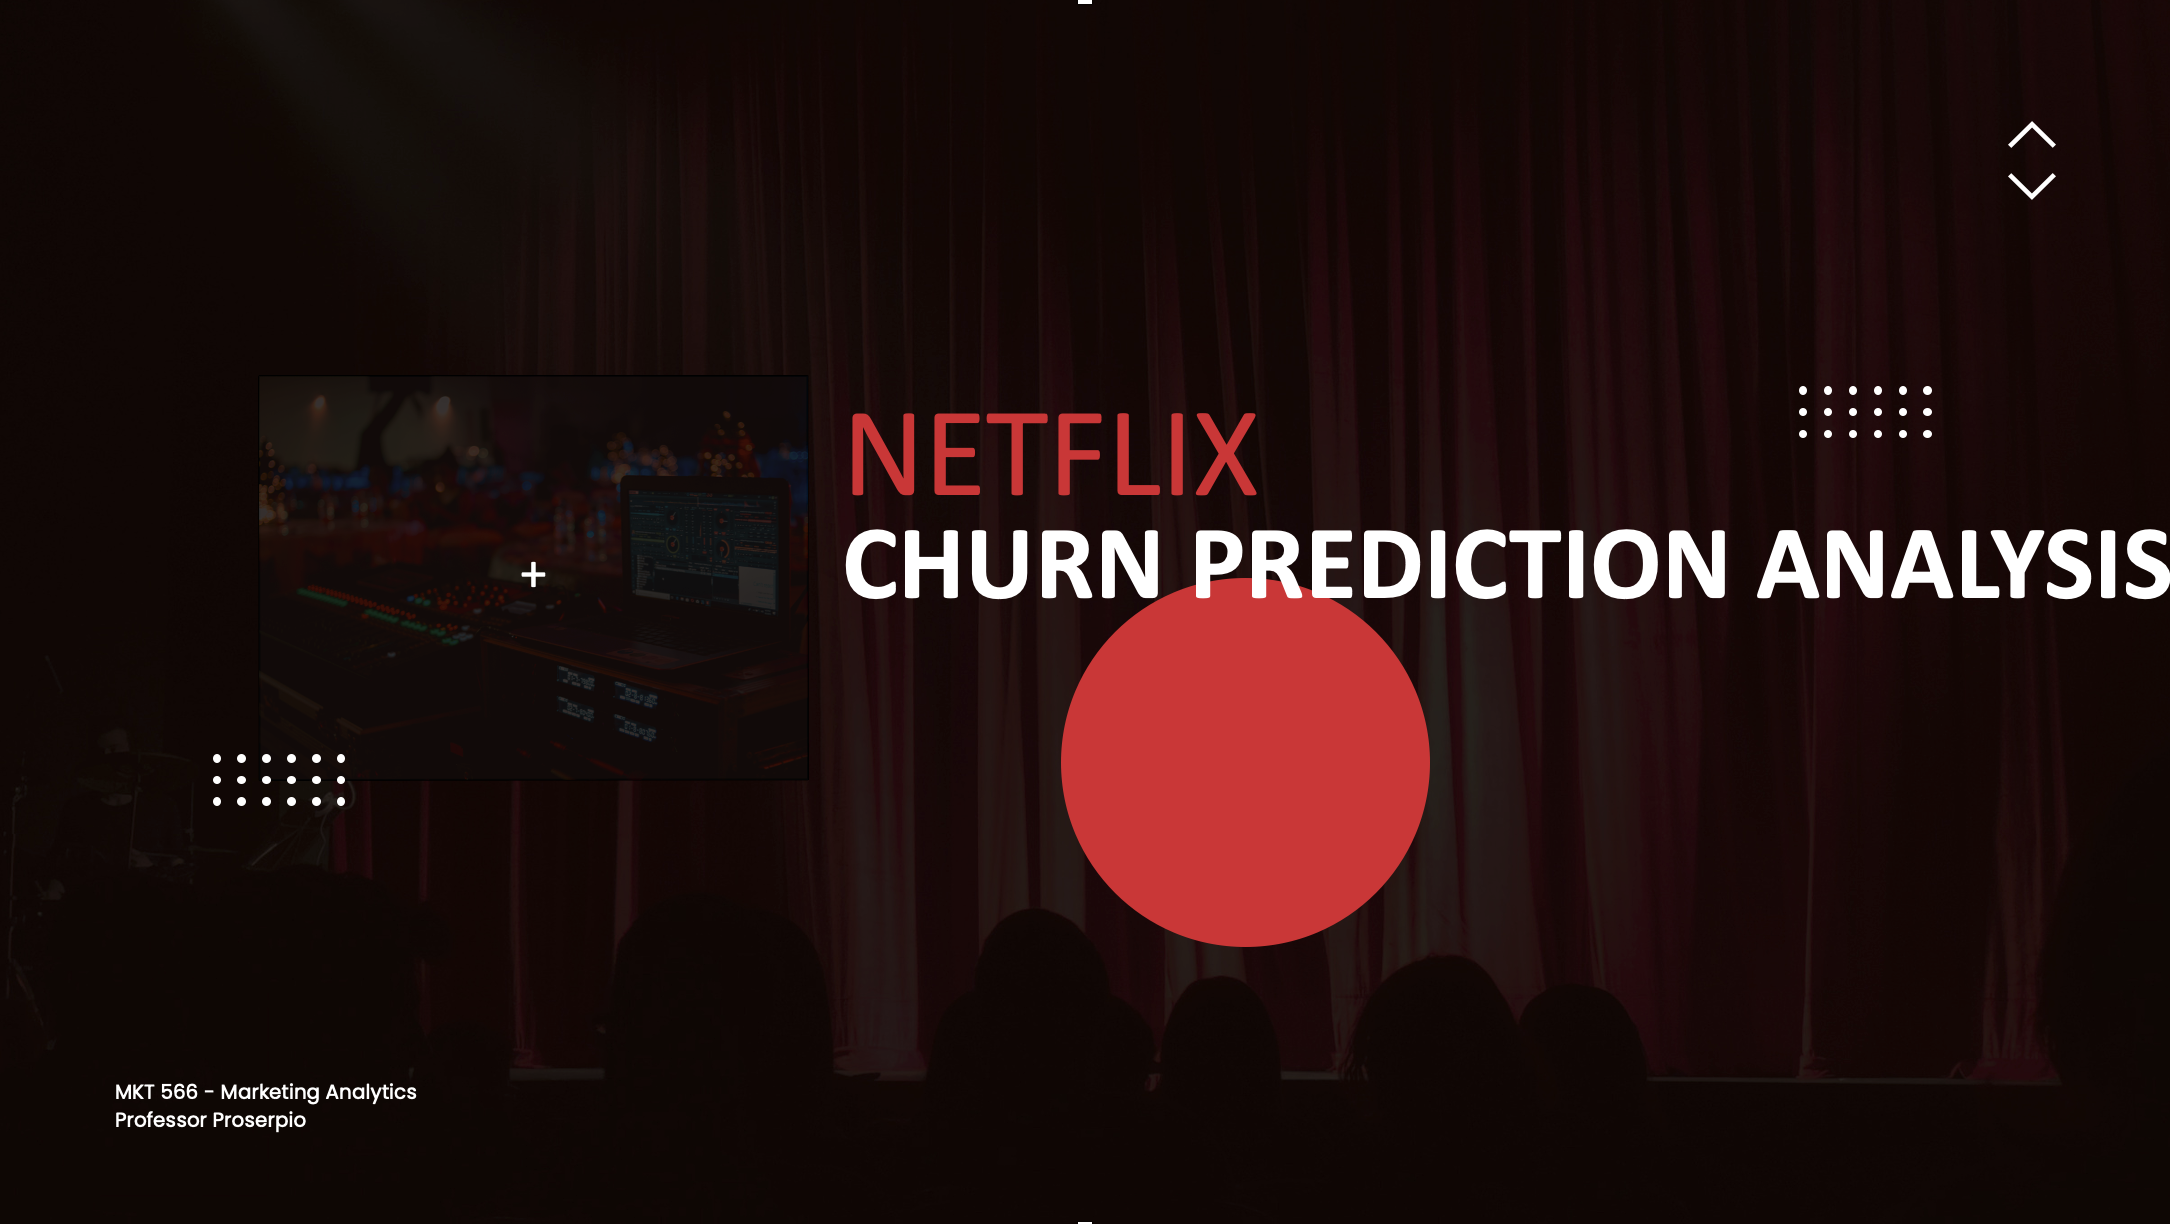
Examples from a colleague’s class
ChatGPT and online content
Using Stack Overflow and YouTube data, students found a decline in Stack Overflow activity for coding topics (Python, Java) alongside an increase in AI-related videos on tech channels.
Examples from a colleague’s class
Sentiment analysis of Sephora reviews
Using customer review data, students asked whether reviews help identify which Sephora products get featured as trending on the website.
Examples from a colleague’s class
Breaking box office
Using Kaggle movie reviews and Box Office Mojo revenues, students documented a null result: customer reviews generally do not explain box office performance, though they may matter for less popular movies.
Examples from a colleague’s class
Gender effects in a dating app
Using Bumble review data, students found that although more users appear to be male, women rate the app higher than men. A nice application of the gender-guesser package.
Where to find data
- Kaggle datasets, e.g. customer churn, shopping trends, Steam
- Yelp open dataset
- Amazon, Google reviews, Steam and more
- Marketing Science papers often ship data and code for replication
- Collect it yourself via an API
I have data on Airbnb, TripAdvisor, Expedia, and Yelp. Ask me if you want it.
Deliverables and deadlines
| Deliverable | Due |
|---|---|
| Form groups | September 15 |
| Mid-term proposal slides (~15 min incl. Q&A) | October 12 (presented Oct 13, 15) |
| Notebook with cleaning and analysis (HTML or PDF) | December 3 |
| Final presentation slides (~15 min incl. Q&A) | November 30 (presented Dec 1, 3) |
| Peer evaluations | December 15 |
Do you want me to form the groups, or would you rather do it yourselves?
Participation
10% of your grade, and it is not just coming to class.
- This course is an active learning experience: participation is graded on the quality and quantity of your contributions in each lecture
- I record attendance at the beginning of most classes
- You can miss up to two sessions without penalty; more than two will lower your participation grade
- If you miss a class, getting the notes and handouts is your responsibility
- Course norms count: be on time, do not leave early, and no phones or other off-task devices; violations affect your participation grade
Read the syllabus
Everything I have just discussed is in the syllabus. Please read it at least once.
Marketing Analytics
What it is
Marketing analytics is the practice of measuring, managing, and analyzing data from marketing activities to optimize business performance.
It covers:
- Data collection and integration
- Visualization and reporting
- Advanced analysis
- Defining, measuring, and tracking performance (KPIs)
- Translating insights into decisions
1. Data collection and integration
- Gathering information from the web, social media, e-commerce platforms, and elsewhere
- Unifying datasets from different sources (online clicks, offline transactions) so they can answer a marketing question together
2. Visualization and reporting
Creating figures, dashboards, and reports that present insights to stakeholders:
- Advertising effect on sales
- Eco-labeling program growth
- Relationships between variables
3. Advanced analysis
- Attribution modeling (causality)
-
Which channels or campaigns deserve credit for conversions?
- Recommendation and segmentation (clustering)
-
Group customers by behavior or demographics to tailor messaging; identify products consumers are likely to buy; product placement
- Predictive modeling (regression, machine learning)
-
Forecast campaign performance; predict churn; identify fraudulent activity such as fake reviews, accounts, and clicks; forecast prices
4. KPIs
| Metric family | Examples |
|---|---|
| Acquisition | Cost per click, cost per acquisition |
| Engagement | Click-through rate, time on site |
| Conversion | Lead-to-customer rate, average order value |
| Retention | Churn rate, customer lifetime value |
| Incrementality | How much of the sales lift is attributable to the campaign |
5. Translating insights into decisions
Turning analysis into action:
- Reallocating budget to top-performing channels
- Optimizing messaging and creative
- Changing the landing page
- Identifying and leveraging new trends
- Optimizing prices
In a nutshell
By systematically applying statistical methods and data-driven storytelling, marketing analytics enables organizations to understand what works, identify growth opportunities, and maximize their return on marketing investment.
The Course Content
What we will cover
- Data analysis and visualization
- Regressions
- Clustering and recommendations
- Classifiers
- Causality: experiments and observational data
- LLMs and agents: new challenges for brands (e.g. search), and how firms are leveraging them
What we will not cover
- This is not a programming course. Learning to code is mostly up to you and your LLM
- This is not an advanced statistics, econometrics, or ML methods course. The emphasis is on data-driven decision-making, so we stay at a high level conceptually
I assume you are familiar with basic statistics and probability. I can post review slides if that would help.
Questions?
MKT 566 · Marketing Analytics