Week 3
Computational Sociology
Christopher Barrie
Introduction
- Housekeeping
- Web tracking and Networks
Introduction: Web tracking
Web tracking a core concern in the study of digital society
1994: HTTP cookie is introduced
2010: term “zombie cookies” is coined
2020: Apple bans third-party cookies
Introduction: Web tracking
And has led to major legislation, e.g.:
GDPR in EU
Draft Online Safety Bill in UK
Introduction: Web tracking
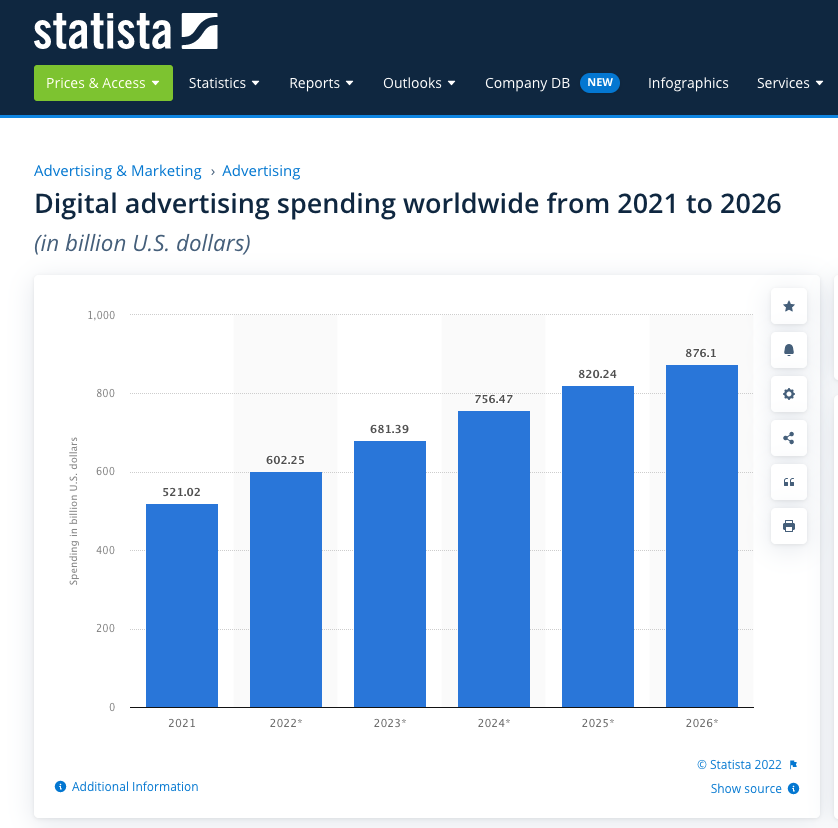
Is now core of enornmous marketplace:
- “data profiling” or “cookie profiling”
And you can view your own profile!
But it’s also useful for us…
Web-tracking methods make accessible:
Granular, real-time data on information consumption
Amenable to experimental intervention
Complementary data source for survey research
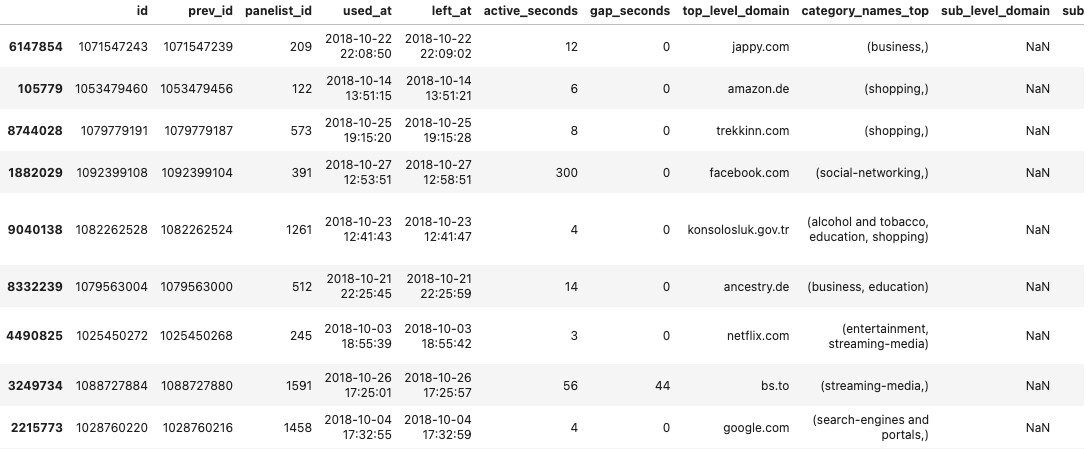
Web-tracking data
What does it look like?
Comes in many forms that might include
- Website visited
- Search terms (inputs)
- Time spent
- Website from which link originated (e.g., going to another website from Twitter)
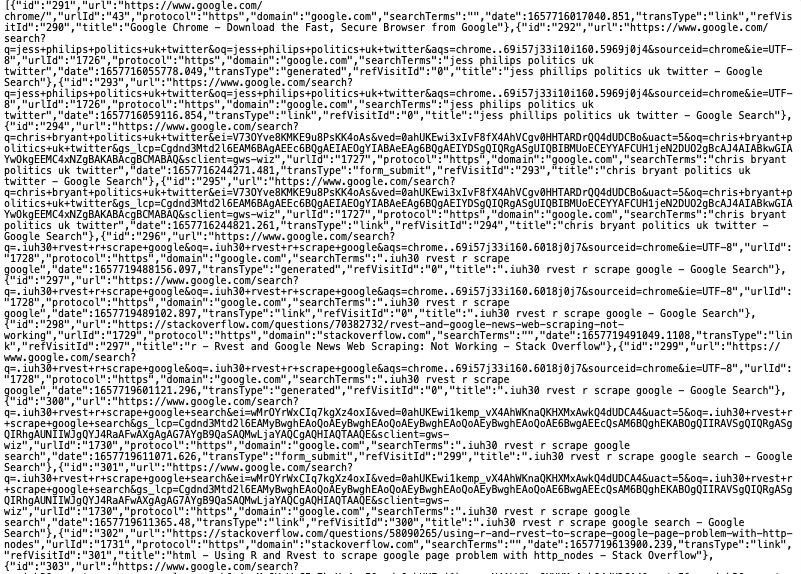
Web-tracking data
What does it look like?
And some add-ons can measure even more, such as:
- Section of screen scrolled to
- Time spent looking at section
- Button clicks (events)
You can look at this too
There are many add-ons/extensions to popular browsers such as Chrome and Firefox.
These include:
An example from Kulshrestha et al. (2020)
An example from…me
What can we do with this data?
View and predicts user habits:
Kulshrestha et al. (2020) find very predictable patterns of routineness
estimate aggregate patterns of information consumption
What can we do with this data?
Pair with surveys to:
understand variation according to demographic attributes
understand variation according to ideological attributes
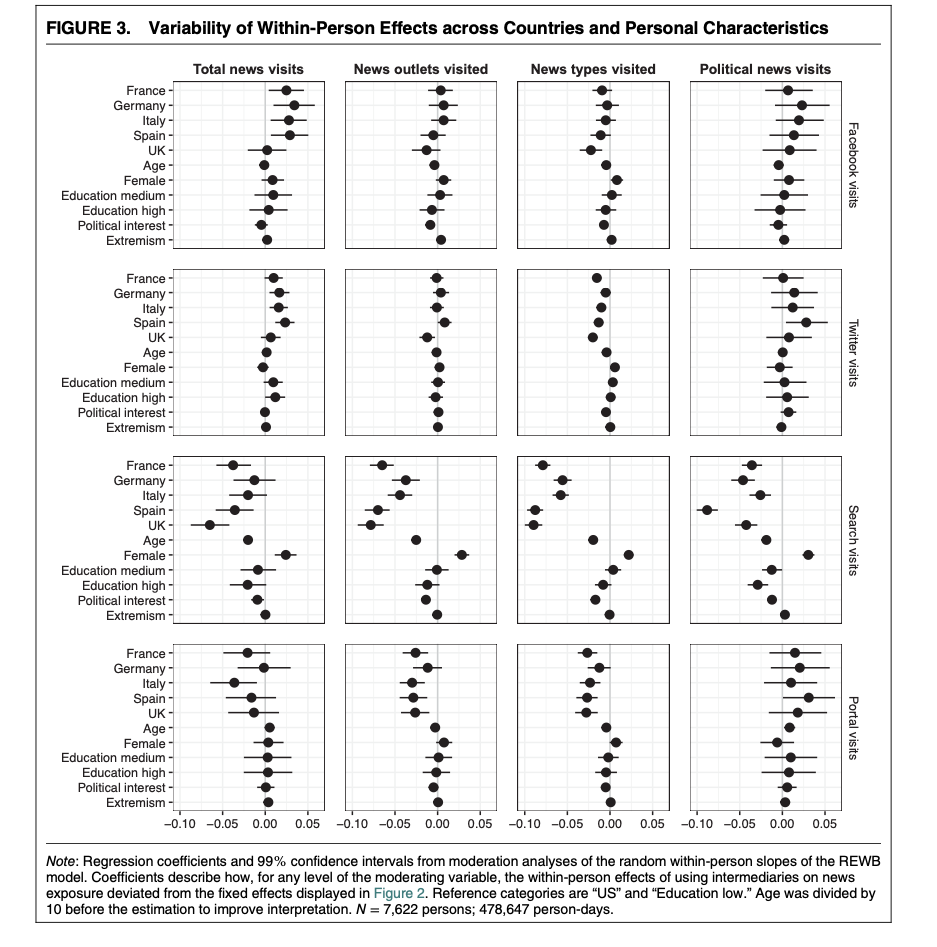
Example: STIER et al. (2021)
7,775 participants who have web-tracking software installed
surveyed for attributes often linked to information inequality
- country, age, gender, education, political interest, and political extremism
surveys + web-tracking behaviour combined
Example: STIER et al. (2021)
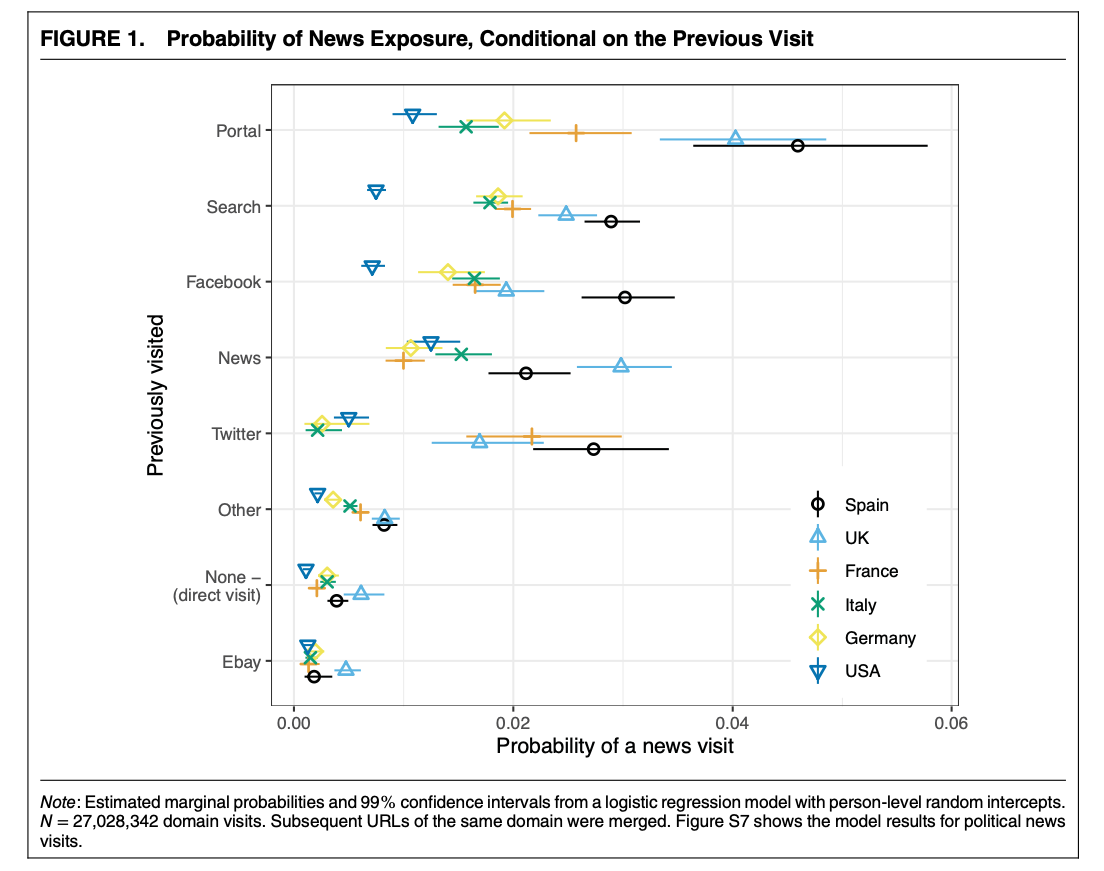
Example: STIER et al. (2021)
Webpages classified accorded to hand-coded list + ML classifier
Panel structure that controls for within-person characteristics
Example: STIER et al. (2021)
Introduction: Networks
What we do and see online is often organized in the form of interactions or ties, e.g.:
Emailing a friend or colleague
Retweeting a news article
Hyperlinks within domains
Introduction: Networks
Any such interaction or link therefore has two types of data associated:
- The origin of the link (e.g., the person who sent the email)
- The destination of the link (e.g., the recipient of that email)
Introduction: Networks
And these elements of network data have their names:
- An individual unit in the network: a “node” or “vertex” (plu.: vertices)
- A link between one node and another node: an “edge” or a “tie”
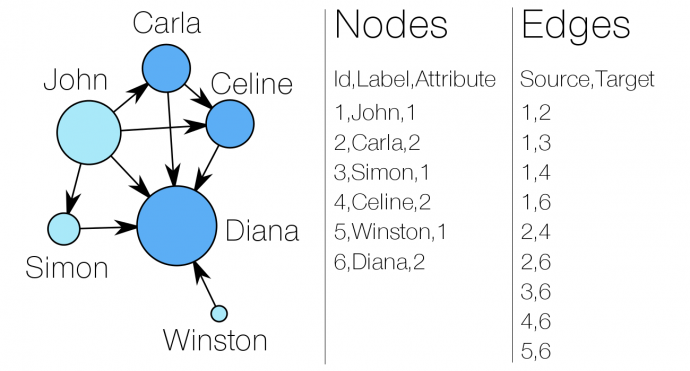
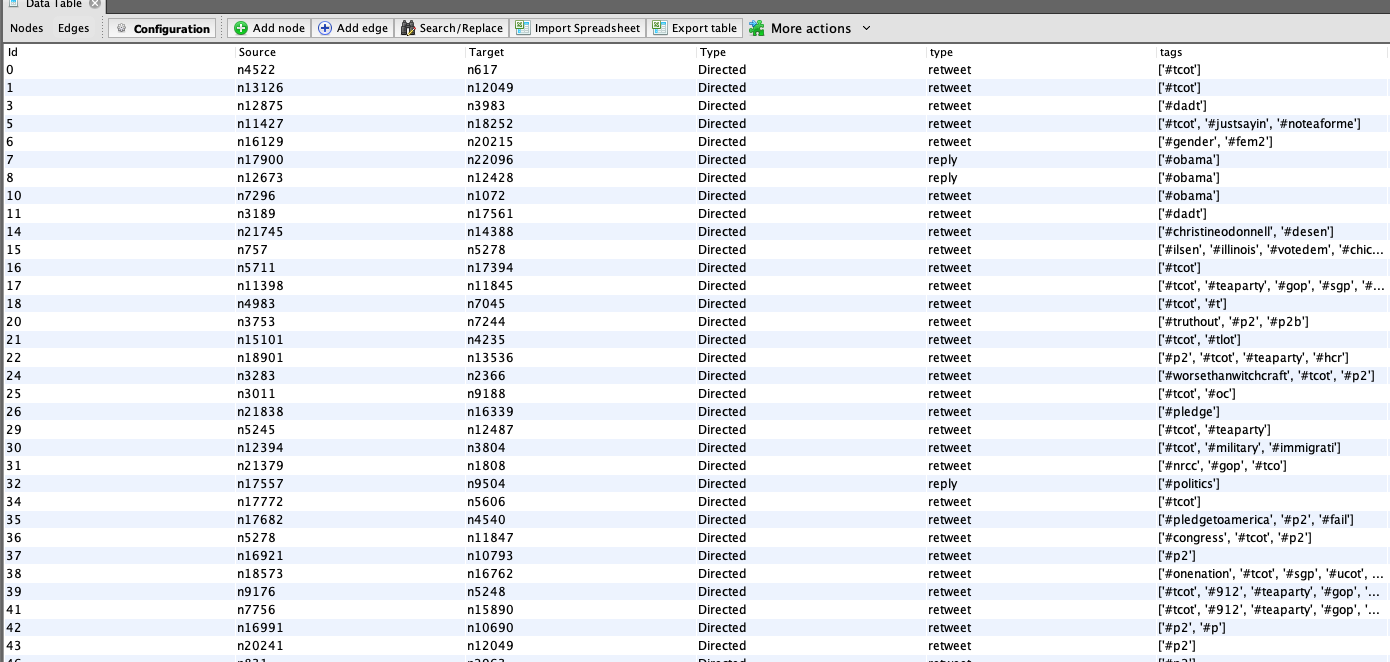
What does the data look like?
What does the data look like?
And it’s useful for us…
For estimating political preferences (cf. last week’s lecture)
For understanding information consumption and e.g.:
polarization in news exposure
diversity in news consumption
For tracking information diffusion and e.g.:
spread of rumours
spread of fake news
Example: Conover et al. (2011)
Data: 250,000 tweets collected before 2010 US midterms
45,000 individual users
Tweets tagged for political content
Example: Conover et al. (2011)
Tagging of political content was with
Jaccard coefficient to determine frequently co-occurring tweets:
- \(\sigma(S,T) = \frac{|S\cap T|}{|S\cup T|}\) where \(S\) is a set of tweets containing seed hashtag and \(T\) a set of tweets containing another hashtag
Example: Conover et al. (2011)
Then filtered data according to appearance of political hashtags
Generated retweet and mentions node and edge data
- Plotted data using community detection algorithm
Example: Conover et al. (2011)
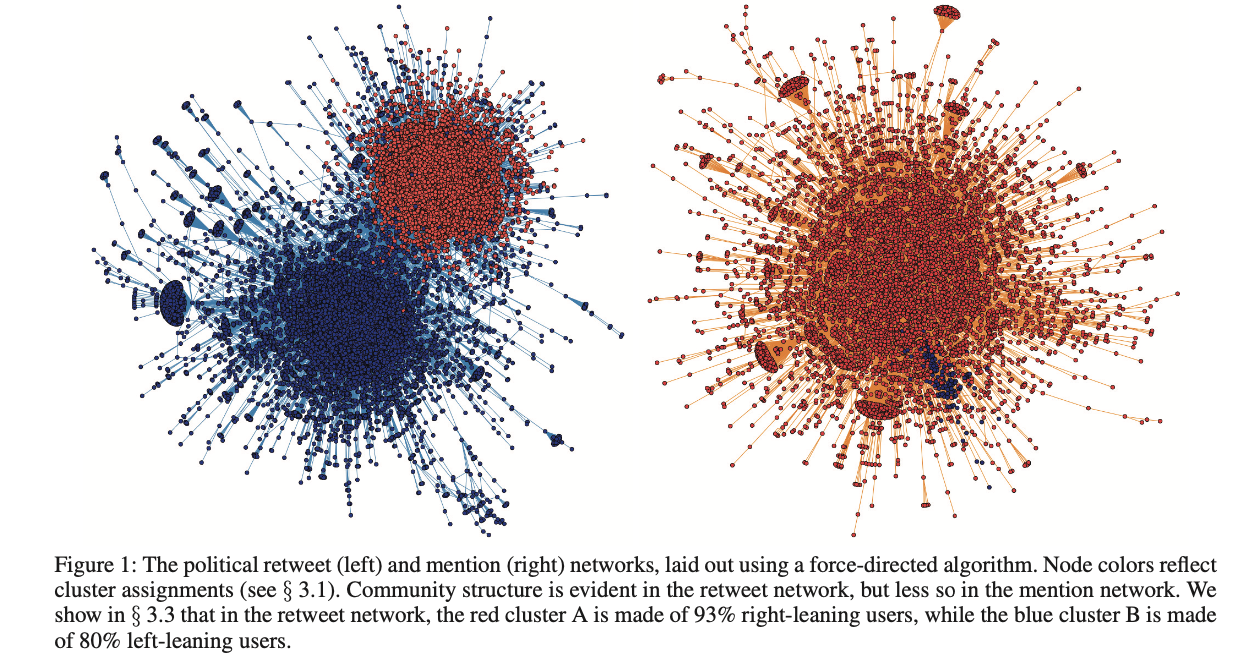
Example: Conover et al. (2011)
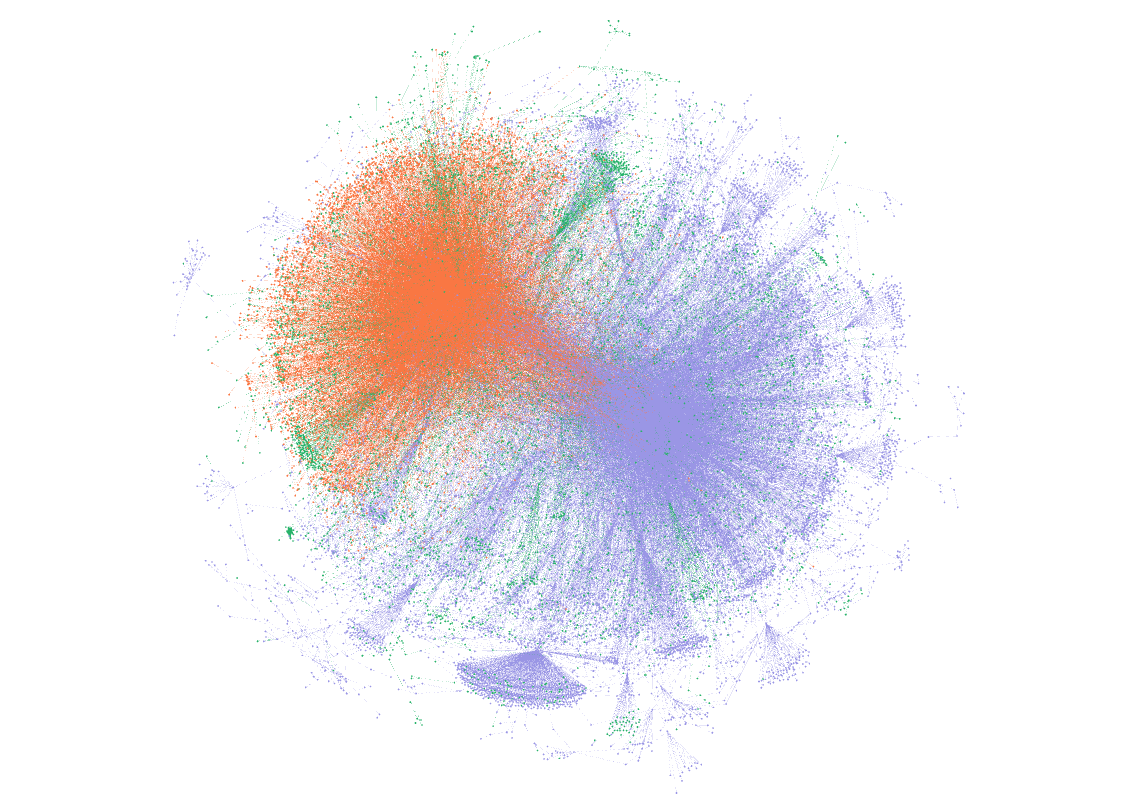
Example: Conover et al. (2011)
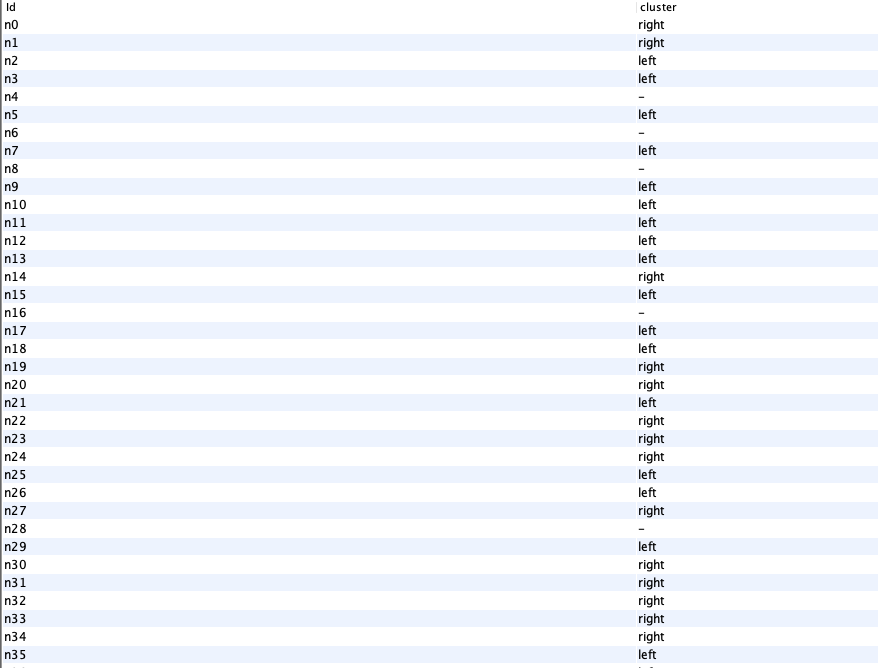
Manually annotated 1000 tweets for left-right affiliation
Measured frequency of cross-ideological retweeting/mentioning
Inferred overall community membership from these statistics
Inferred membership of (left-right) community from community detection statistic
A note on computational thinking
Taking digital trace data and:
Asking questions that can be articulated in computational terms
Enriching that data (through computational/non-computational means)
Abstracting that data into approximate solution