class: center, inverse, middle <style>.xe__progress-bar__container { top:0; opacity: 1; position:absolute; right:0; left: 0; } .xe__progress-bar { height: 0.25em; background-color: #808080; width: calc(var(--slide-current) / var(--slide-total) * 100%); } .remark-visible .xe__progress-bar { animation: xe__progress-bar__wipe 200ms forwards; animation-timing-function: cubic-bezier(.86,0,.07,1); } @keyframes xe__progress-bar__wipe { 0% { width: calc(var(--slide-previous) / var(--slide-total) * 100%); } 100% { width: calc(var(--slide-current) / var(--slide-total) * 100%); } }</style> <style type="text/css"> .pull-left { float: left; width: 44%; } .pull-right { float: right; width: 44%; } .pull-right ~ p { clear: both; } .pull-left-wide { float: left; width: 66%; } .pull-right-wide { float: right; width: 66%; } .pull-right-wide ~ p { clear: both; } .pull-left-narrow { float: left; width: 30%; } .pull-right-narrow { float: right; width: 30%; } .pull-right-extra-narrow { float: right; width: 20%; } .pull-center { margin-left: 28%; width: 44%; } .pull-center-wide { margin-left: 17%; width: 66%; } .tiny123 { font-size: 0.40em; } .small123 { font-size: 0.80em; } .large123 { font-size: 2em; } .red { color: red } .orange { color: orange } .green { color: green } .blue { color: blue } </style> # From Geography to Prosperity via new methodological routes ### *Or* ## *What I am trying to achieve in my research* ### Christian Vedel, ### Email: [christian-vs@sam.sdu.dk](christian-vs@sam.sdu.dk) ### Updated 2025-07-03 --- class: middle .pull-left-wide[ # What this is > A personal of what I have *(hopefully not)* wasted my time with in the past ~6 years + Some thoughts ahead `\(^1\)` .footnote[ `\(^1\)`*Hopefully you find this useful somehow - it's useful for me* ] ] --- class: middle ## Why This Journey & Where It's heading 1. **Motivation** - Can we improve life quality substantially? How? – What Denmark’s micro-experiments teach about economic development 2. **Puzzles** *Geography • Institutions • Culture • Persistence* 3. **Evidence toolbox** Causal inference | GIS & archival data | Machine-learning tools 4. **Case studies** - Coal & Peat - A Perfect Storm - OccCANINE - CHAOS 5. **What I'm spending my time on** --- class: middle .pull-left-wide[ # From Rome to Economic History ] .pull-right-narrow[  .small123[ *A much too flattering version of how I learned to love econ* *Generated by ChatGPT* ] ] ??? - **Spark moment – Rome, study trip, 2012** *Realised a city can outlive generations; wanted to know the forces behind such endurance.* - **Dual fascination** *Blend of "hard" (quantitative) and "soft" (historical-institutional) sciences.* - **Research lens** *Causal inference × Geography × Institutions & Culture* - How shocks (natural, social, technological) redirect long-run development. --- class: middle .pull-left-wide[ .pull-right-wide[ ## How to improve the world? ### 'Easy' answer - Go into politics ### 'Hard' answer - Do research and learn something about it - (And learn that you cannot generally improve things) ] ] .pull-right-narrow[ .pull-left[  .small123[ **Current identity** ] ] .pull-right[  .small123[ **BTDT** ] ] ] --- .pull-left[ # Projects overview .small123[ #### Published - .orange[Sharp et al (2023): A database of 1419 Danish cooperative creameries 1898-1945] - .orange[McLaughlin et al (2023): A database of 531 Irish cooperative creameries 1897-1921] - .green[Henriques et el (2024): Peat availability and energy shocks (in creameries)] - .blue[McLaughlin et al (2025): Denmark vs Ireland: Producitvity (of creameries)] #### Working papers - .red[Religious identity in the US (Boberg et al, 2024), Denmark (Bentzen et al, 2023) and Ireland (McLaughlin et al, 2024)] - .orange[Automatic Occupational Standardization with OccCANINE (Dahl et al, 2024)] - .green[A perfect storm (Vedel, 2024)] - .green[Track to Modernity (Görges et al, 2025)] - .red[Milk and conflict in Ireland (McLaughlin et al, 2024)] ] ] .pull-right[ .pull-righ-wide[ **.red[Culture]; .green[Geography]; .blue[Institutions]; .orange[Data / methods]**  ] .small123[ #### Works in progress (too much) - .green[Railways and the Happy Danes] + .blue[Tracks to Modernity (submitted)] + .orange[Railways and things to find in many historical pictures] - .red[Facing success: Pictures and student biographies] - .orange[CHAOS: Converting Historical Accounts Into Occupational Scores] - .blue[Vikings and Nazis] - .orange[Occunyms: Is Mr. Smith's son more likely to have the social status of a Smith?] - .orange[PST version of OccCANINE ++] - *Probbably a few things I forgot* ] ] .footnote[ .tiny123[ *If anyone wonders where my name is in many of these - then don't get a last name starting with 'V' yourself.* ] ] --- class: inverse, middle, center ## Some projects, published, working paper, early stage --- class: middle # Peat and coal .small123[ *Published in Energy Economics in 2024* ] .pull-left[ .small123[ "Adaptability, diversification, and energy shocks: A firm level productivity analysis" w. Sofie Henriques, Paul Sharp and Xanthi Tsoukli [doi.org/10.1016/j.eneco.2024.107887](https://doi.org/10.1016/j.eneco.2024.107887) ] - Because of WWI and the Spanish Flu, Coal imports from England were strained - Some creameries were located closer to an (inferior but available) alternative: Peat - Short run and long run benefits ### Process reflection - Started off in another PhD students project - needed help with the econometrics - Working paper out in 2021 - Was rejected approx 4-5 different journals - Finally decided to fix up weird econometrics ] .pull-right[  .small123[*Figure 6:* Descriptive plot of efficiency and peat avilability] ] --- class: middle ## A perfect storm: First-Nature Geography and Economic Development .pull-left[ .small123[ Submitted to the AER 44 days ago (fingers cross for reports with the rejection) https://arxiv.org/abs/2408.00885 ] - How much of the location of prosperity is determined by first-nature geography? - In 1825 an unexpected storm completely altered the first-nature characteristics of North Western Denmark - 25% population growth within a generation + fertility + manufacturing ### Process reflection - Stumbled on the idea on vacation - The struggle was with framing it in the literature - When should you prioritize your own stuff? ] .pull-right[  *Figure 1: A map of how the West Limfjord region changed in 1825* ] --- class: middle # OccCANINE .pull-left[ .small123[ w. Christian Møller Dahl & Torben Johansen Final review of new version TBD before submitting to JEH https://arxiv.org/abs/2408.00885 ] - An important economic activity is work - Historical sources are ripe with information of peoples' occupation but it needs to be standardized - We train a language model on ~20 million observations spanning 13 different language from 29 different sources - Open source, user friendly, fast and highly accurate ### Process reflection - Was an appendix - Networking effort to get data - Last mile problem ] .pull-right[ 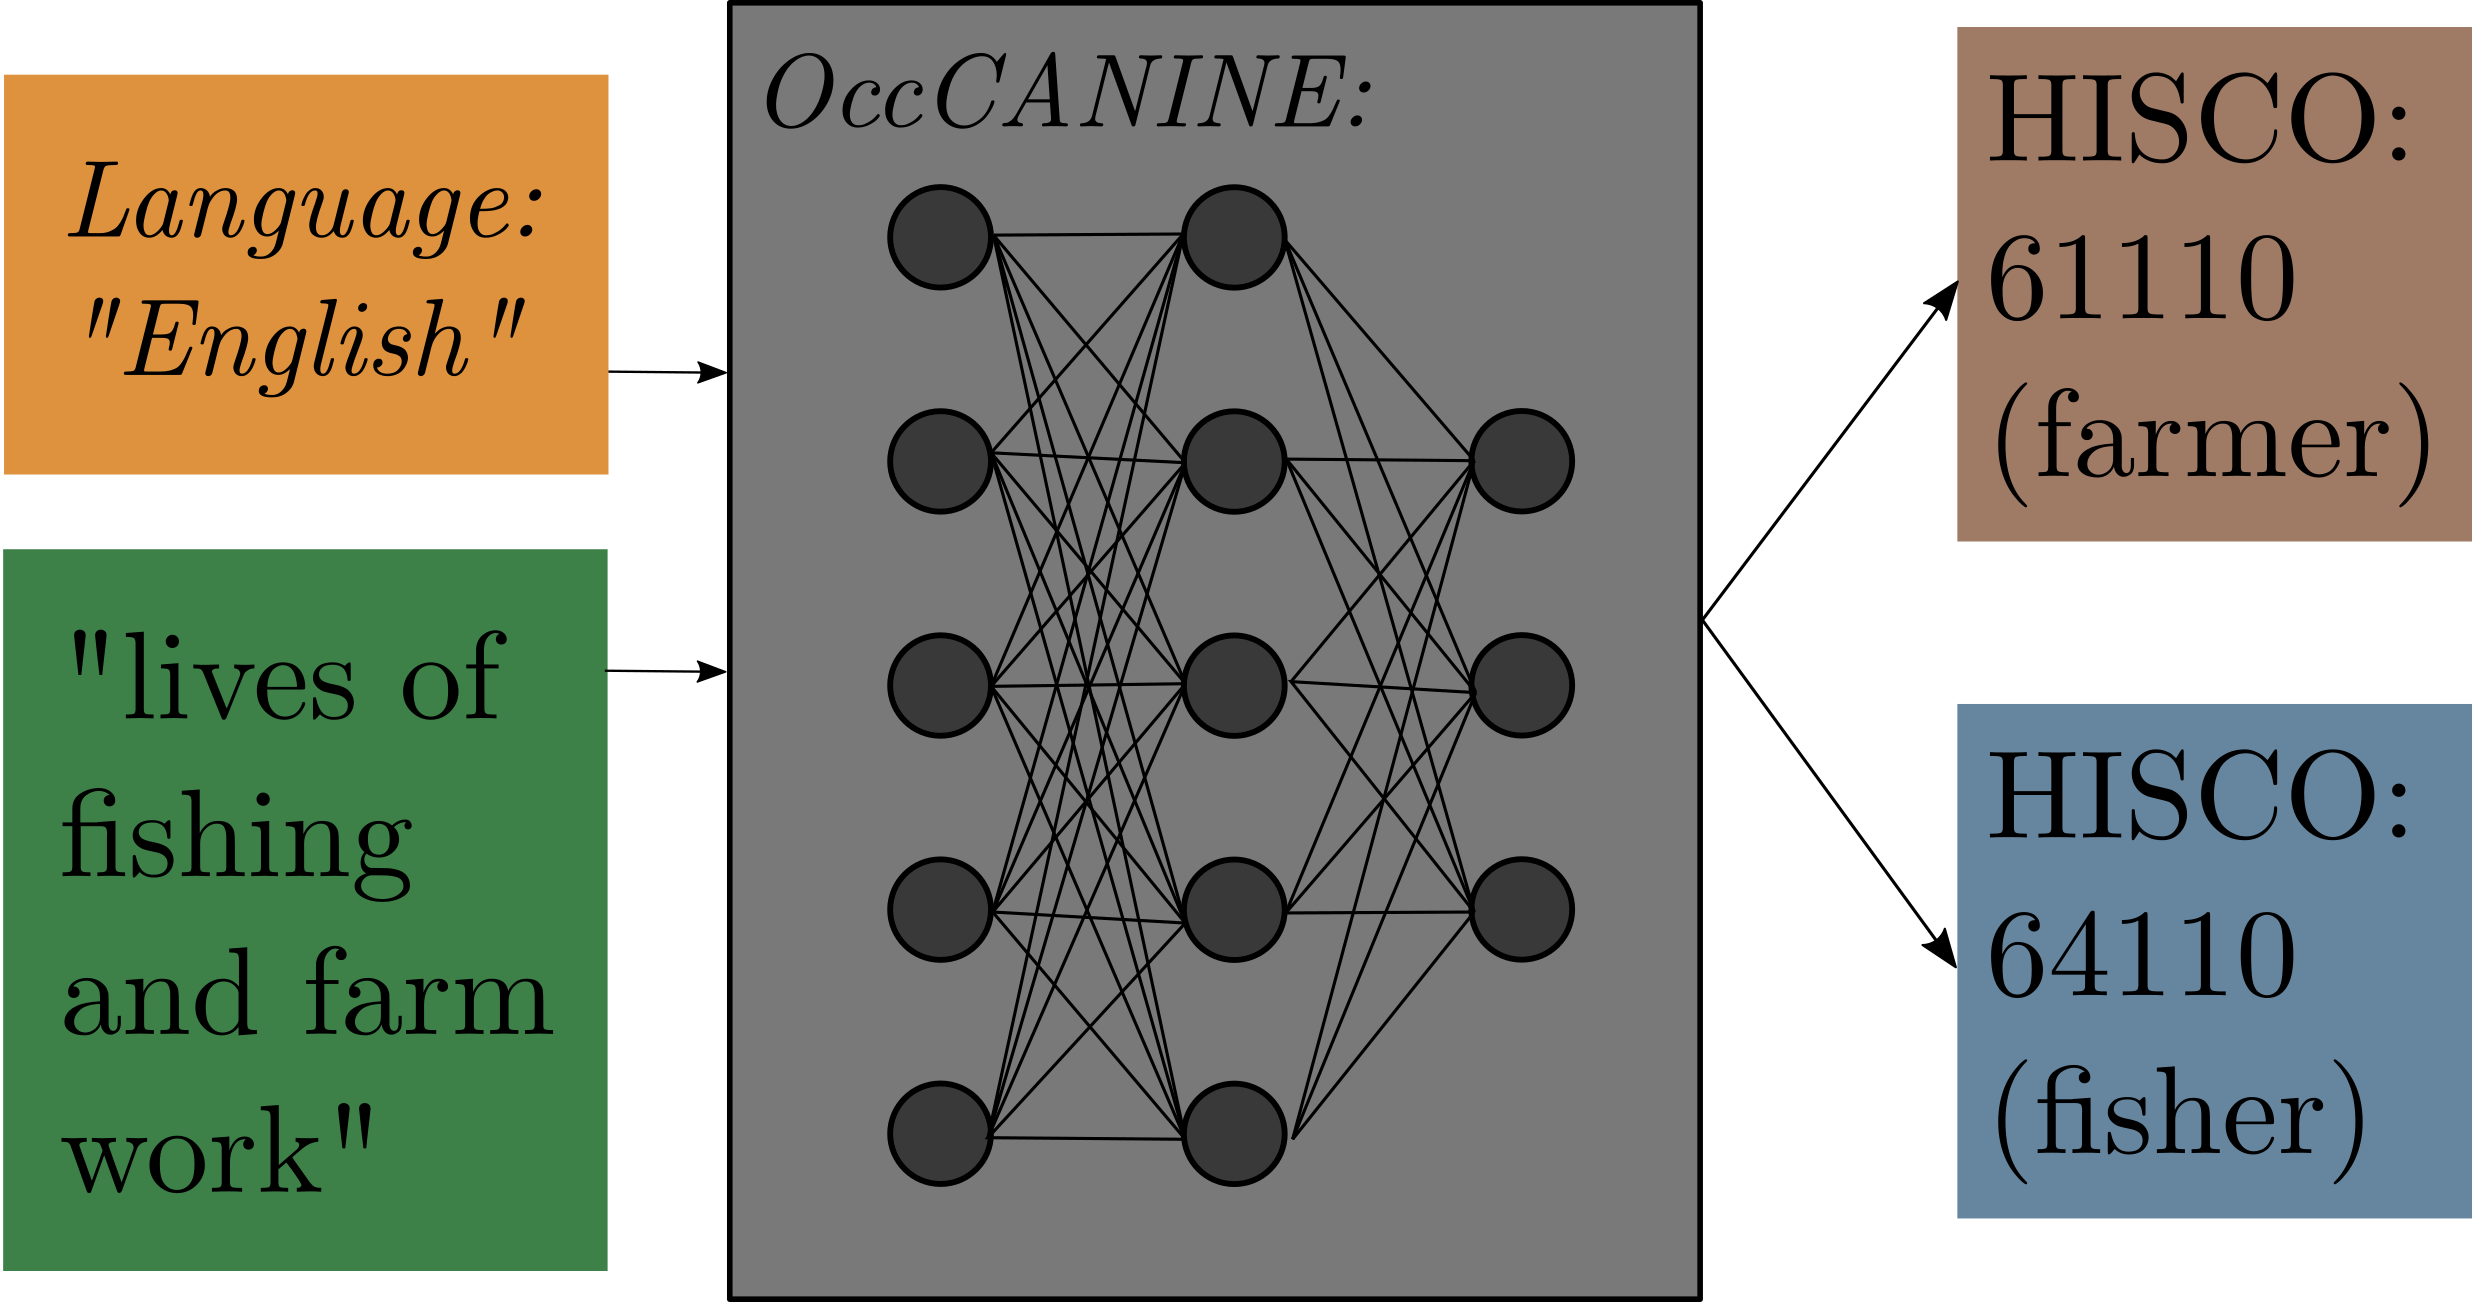 *Figure 1: Conceptual architecture* .small123[ #### Some numbers: - 10k occupational descriptions: 27 seconds - 100k occupational descriptions: 5 min. - 1 million occupational descriptions: 45 min. `\(\rightarrow\)` .red[*Compared to 3.5, 35 and 350 RA working days*] ] ] --- ## CHAOS: Converting Historical Accounts into Occupational Scores .small123[ w. Matt Curtis, Torben Johansen, Julius Koschnick ] .pull-left[ .small123[ - Your job is a useful proxy of your (expected) income - Common setup in history: + Source: Some agency noted average wages for certain occupations + In the censuses we now what job people had - Can we infer their level of income (already done) flexibly and automatically using the most relevant *local* sources + skill, education, etc. (contribution) - Trick: It's all based on probabilities of *OccCANINE* ### Process reflection - Presented this summer - Let's see how it goes - 'Residual' time project ] ] .pull-right[ 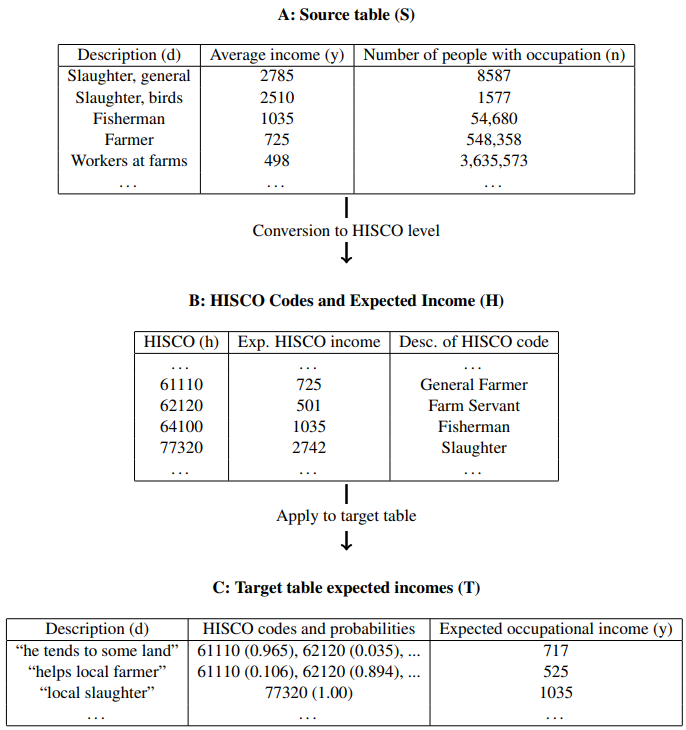 ] --- # CHAOS (if time) .pull-left-wide[ ### Intro 1 - Given: 1. classifier `\(d \mapsto Pr(h|d)\)`, and 2. source `\(\{d_i, \mathbb{E}(y_i|d_i)\} \forall i \in[0,n]\)`, where `\(d\)` is a text string, `\(h\)` is some classiciation of that string and `\(y\)` is some outcome of interest, can we: > Estimate `\(\mathbb{E}(y_i|d_i)\)` for new observations of text strings, `\(d\)` ### Intro 2 - Can we combine relevant sources to get local estimate of expected occupational wages? ] --- # Background .pull-left[ - A lot of papers out there are based on 'occscore' from IPUMS + 1950s US occupational wages + Less ideal the further you get away from 1950s US - What if you could construct something similar, automatically using the most relevant local sources? #### Uses - .red[*Women's return to education in the US*] - What happens to income / occupational structure when new technologies emerge? - Can economies adapt to climate change? - What is the social mobility across different types of societies? - What was the effect of abolishing slavery? - Do certain institutions promote economic development? ] --- ## How to build an occscore index *How e.g. IPUMS occscore is constructed* .pull-left[ 1. Find *Source table*: a. Occupational descriptions: `\(d_i\)` ("carpenter", "best carpenter", "fishmonger", "butcher", "farmer", "has some land") b. Average incomes for each of these: `\(y_i\)` (125, 130, 198, 201, 107) 2. Turn descriptions into some system (OCC1950, HISCO, PST, etc.) 3. Make judgement calls to collapse and distribute information into an index with *one* average income for each code 4. (Hidden): Application: We have some new data where we only have descriptions. We want to know what they *earned* on average. ] -- .pull-right[ .red[ - *All of this consists of various difficult, important and non-replicable judgement calls.* - *We want to automate this.* ] ] --- # What we do (1/2) ### *"It could easily accomplished with a computer"* - Dr. Strangelove .pull-left-wide[ Imagine having some data: | Occupation | Income | |-------------|--------| | Carpenter | $2.00 | | Butcher | $2.00 | | Farmer | $2.30 | Form this imagine constructing a function which takes a text string and outputs an estimated income, years of education, social status, etc. for a given place `\(i\)` and time `\(t\)`: $$ f_{it}(\textit{"He has some land"}) = 1.71844 $$ ] --- # What we do (2/2) An occupational index is a weighted mean: `$$\mathbb{E}(y_i|h_j)=\sum_{i \in \mathbf{S}} y_i w_i.$$` -- E.g. the income of "61110 Farmer" could be `$$0.47\times y_\text{"farmer"} + 0.45 \times y_\text{"has some land"} + 0.08\times y_\text{"butcher"}$$` `$$0.47\times 123 + 0.45 \times 107 + 0.08 \times 198 = 121.8$$` -- #### OccCANINE can help with deriving these weights: `$$w_i= \overset{OccCANINE}{\overbrace{Pr(h_j|d_i)}} \frac{\overset{Prior}{\overbrace{Pr(d_i)}}}{\underset{Norm.}{\underbrace{Pr(h_j)}}}$$` -- ...And we can also use OccCANINE to apply HISCO wage index to descriptions. E.g. if a census entry is 75 pct "61110", then it should be given this 75 pct of this income --- # Application .pull-left-wide[ - Commission of labor reports spanning 1750-1900 for various occupations and countries/states - London Trademan - an 18th description of what historical occupations required (which we turn into skill measures using NLP) #### Product: A measure of long run changes in skill premium ] --- # Examples .pull-left-narrow[ - What we do with it ] .pull-right-wide[ .panelset[ .panel[.panel-name[A] .pull-left-wide[ .pull-right-wide[ 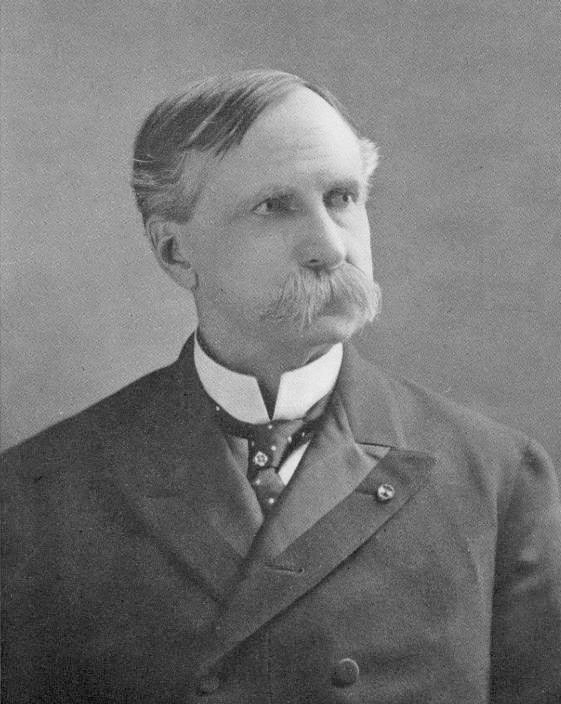 *Caroll D. Wright* ] ] ] .panel[.panel-name[B] .pull-left-wide[ .pull-right-wide[ 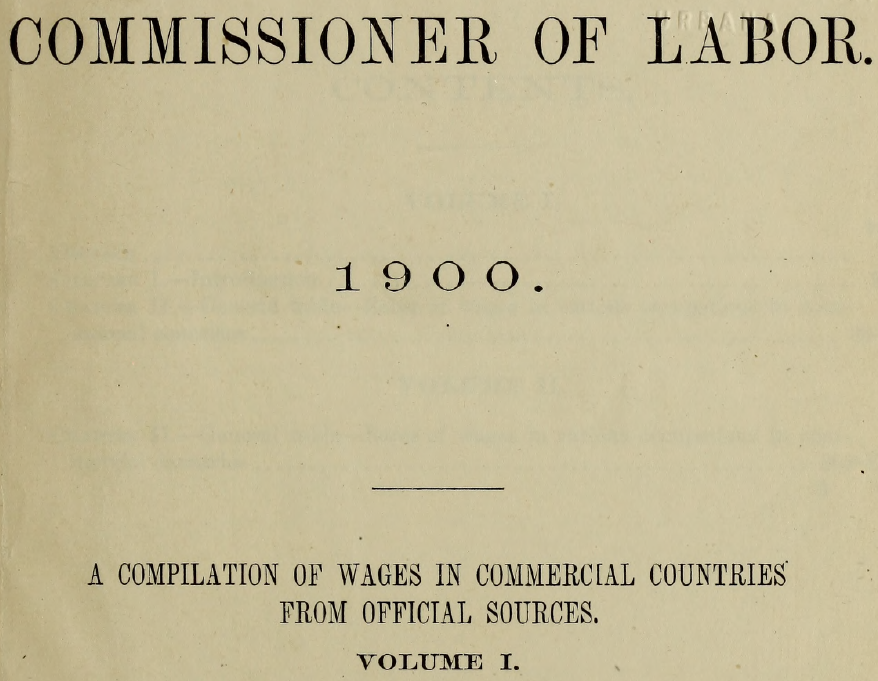 ] ] ] .panel[.panel-name[C]  ] .panel[.panel-name[D] .pull-left-wide[ .pull-right-wide[  ] ] ] .panel[.panel-name[E]  ] .panel[.panel-name[F]  ] ] ] --- # How I spend my time .pull-left-wide[ .panelset[ .panel[.panel-name[Weekly work time]  ] .panel[.panel-name[Share spend]  ] .panel[ .panel-name[Table] |Metacategory |Before PhD |After PhD |Pct change | |:--------------------|:----------|:---------|:----------| |Admin |21.4% |18.5% |-13.8% | |Dissemination |5.92% |5.67% |-4.26% | |Learning |22.7% |5.76% |-74.7% | |Public dissemination |0.491% |0.698% |42.2% | |Research |42% |42.3% |0.741% | |Teaching |7.39% |27.1% |266% | ] ] ] --- class: middle # An agenda .pull-left-wide[ #### Two legs: Doing applied work in EH and developing the methods for it 1. The mystery of prosperity and how to create it 2. How to get reliable data and inference ]