class: center, inverse, middle <style>.xe__progress-bar__container { top:0; opacity: 1; position:absolute; right:0; left: 0; } .xe__progress-bar { height: 0.25em; background-color: #808080; width: calc(var(--slide-current) / var(--slide-total) * 100%); } .remark-visible .xe__progress-bar { animation: xe__progress-bar__wipe 200ms forwards; animation-timing-function: cubic-bezier(.86,0,.07,1); } @keyframes xe__progress-bar__wipe { 0% { width: calc(var(--slide-previous) / var(--slide-total) * 100%); } 100% { width: calc(var(--slide-current) / var(--slide-total) * 100%); } }</style> <style type="text/css"> .pull-left { float: left; width: 44%; } .pull-right { float: right; width: 44%; } .pull-right ~ p { clear: both; } .pull-left-wide { float: left; width: 66%; } .pull-right-wide { float: right; width: 66%; } .pull-right-wide ~ p { clear: both; } .pull-left-narrow { float: left; width: 30%; } .pull-right-narrow { float: right; width: 30%; } .tiny123 { font-size: 0.40em; } .small123 { font-size: 0.80em; } .large123 { font-size: 2em; } .red { color: red } .orange { color: orange } .green { color: green } </style> # Statistics ## Estimating the mean using a simple random sample ### (Chapter 10) ### Christian Vedel,<br>Department of Economics<br>University of Southern Denmark ### Email: [christian-vs@sam.sdu.dk](mailto:christian-vs@sam.sdu.dk) ### Updated 2026-04-17 --- class: middle # Today's lecture .pull-left-wide[ **Estimating the population mean from a sample, and understanding the properties that make an estimator reliable.** - **Section 1:** Simple random sampling - **Section 2:** Constructing an estimator of the mean value - **Section 3:** Properties of estimators - **Section 4:** The distribution of the estimator `\(\bar{X}\)` ] .pull-right-narrow[  ] --- # What are we building towards? .pull-left-wide[ - Suppose you compute the sample average wage from 800 workers: `\(\bar{x} = 47{,}200\)` DKK - That is just a number. The real question is: **what does it tell us about the world?** ] -- .pull-left-wide[ - Is the true average wage above 45,000 DKK? Could the gap between men and women be zero and we just got unlucky with our sample? - To answer these questions we need to know **how much to trust our estimate** — i.e. how the estimator `\(\bar{X}\)` behaves across all possible samples ] -- .pull-left-wide[ - This lecture builds the foundation. Once we know the distribution of `\(\bar{X}\)`, we can: - Build a **confidence interval**: a range of plausible values for the true mean - Run a **hypothesis test**: decide whether an effect is real or just noise - Do **inference**: draw conclusions about populations from samples ] -- .pull-right-narrow[ *We will 'invent' an estimator of the mean: the average of the sample. And then we will study its properties. This is a common task in econometrics.* ] --- class: inverse, middle, center # Simple random sampling --- # Descriptive measures in a sample .pull-left-wide[ - Often, we want to derive information from a sample about the unknown distribution in the population ] -- .pull-left-wide[ - There are various ways to characterize the population distribution, but it is common to use a **descriptive measure** ] -- .pull-left-wide[ - The question is: how can we use the information in the sample to infer something about the value of a descriptive measure in the population? ] --- # Simple random sample .pull-left-wide[ > A **simple random sample** is a sample `\((X_1, X_2, \ldots, X_n)\)` such that: > > 1. `\(X_1\)`, `\(X_2\)`, `\(\ldots\)`, `\(X_n\)` are statistically independent > 2. `\(X_1\)`, `\(X_2\)`, `\(\ldots\)`, `\(X_n\)` have the same marginal distribution `\(f_X(x)\)` ] -- .pull-left-wide[ - The marginal distribution `\(f_X(x)\)` is the distribution of interest (in the population) ] -- .pull-left-wide[ - The second condition assures that the simple random sample is a representative sample for `\(X\)` ] -- .pull-right-narrow[ > .red[If data is generated according to the rules of being above, we say that it is **i.i.d.** (independent and identically distributed)] ] --- # Distribution of a simple random sample .pull-left-wide[ - It is easy to determine the joint distribution of the sample using the two conditions in the definition: `$$f(x_1, \ldots, x_n) = f_X(x_1) \cdot f_X(x_2) \cdot \ldots \cdot f_X(x_n)$$` ] -- .pull-left-wide[ - So, if we knew the distribution of `\(X\)` in the population, we would be able to determine the distribution of the simple random sample ] --- # Distribution of a simple random sample .pull-left-wide[ - For example, suppose `\(X\)` follows a Bernoulli distribution with `\(p = 0.7\)`, so `\(f_X(0) = 0.3\)` and `\(f_X(1) = 0.7\)`, and `\(n = 3\)` ] -- .pull-left-wide[ - Then we can calculate `\(f(x_1, x_2, x_3)\)` for any realized sample: `$$f(0, 0, 0) = f_X(0) \cdot f_X(0) \cdot f_X(0) = 0.3^3 = 0.027$$` `$$f(0, 0, 1) = f_X(0) \cdot f_X(0) \cdot f_X(1) = 0.3^2 \cdot 0.7 = 0.063$$` `$$\vdots$$` `$$f(1, 1, 1) = f_X(1) \cdot f_X(1) \cdot f_X(1) = 0.7^3 = 0.343$$` ] -- .pull-right-narrow[ .red[**But, remember:** In practice, we do not know the distribution of `\(X\)` in the population. We have to infer rather than deduce.] ] --- # .red[Raise your hand 1: Simple random sampling] <div class="countdown" id="timer_ef1c4732" data-update-every="1" tabindex="0" style="top:TRUE;right:0;"> <div class="countdown-controls"><button class="countdown-bump-down">−</button><button class="countdown-bump-up">+</button></div> <code class="countdown-time"><span class="countdown-digits minutes">00</span><span class="countdown-digits colon">:</span><span class="countdown-digits seconds">20</span></code> </div> .pull-left-wide[ **Q1.** A researcher surveys 200 workers by asking each manager to nominate two employees. Is this a simple random sample? - **A)** Yes — the sample size is large enough to be representative - **B)** No — nominations by managers likely violate independence and identical distribution; certain workers are more likely to be chosen - **C)** Yes — as long as each worker could in principle be nominated ] -- .pull-left-wide[ **Q2.** We draw a simple random sample `\((X_1, X_2, X_3)\)`. A colleague says: "Since the draws are independent, `\(f(x_1, x_2, x_3)\)` tells us nothing about the population distribution `\(f_X\)`." Is this right? - **A)** Yes — independence means the joint distribution carries no information about the marginal - **B)** Yes — we need a much larger sample before `\(f_X\)` can be inferred - **C)** No — because `\(f(x_1, x_2, x_3) = f_X(x_1) \cdot f_X(x_2) \cdot f_X(x_3)\)`, the joint distribution is built directly from `\(f_X\)` ] --- class: inverse, middle, center # Constructing an estimator of the mean value --- # Estimating the mean value .pull-left-wide[ - Recall that each element of the sample is a random variable following the same distribution - In other words, each element of the sample has the same mean value ] -- .pull-left-wide[ - We could use each realized value as an estimate (approximation) of the mean ] -- .pull-left-wide[ - This gives us `\(n\)` different estimates of one value `\(\Rightarrow\)` we should combine them into one single value ] --- # The analogy principle .red[*This is the central principle of estimation. You meet it everywhere.*] -- .pull-left-wide[ - The **analogy principle** of estimation says: use the formulas we would use if we knew the population distribution, but replace all unknown population quantities with the corresponding sample quantities ] -- .pull-left-wide[ - If we knew the distribution of `\(X\)`, taking values `\(x_1, \ldots, x_N\)` with probabilities `\(f(x_1), \ldots, f(x_N)\)`, its mean value is: `$$\mu = \sum_{i=1}^N x_i f(x_i) = x_1 f(x_1) + x_2 f(x_2) + \ldots + x_N f(x_N)$$` ] --- # The sample average .pull-left-wide[ - In practice, we have a sample of `\(n\)` values `\(x_1, x_2, \ldots, x_n\)`, each occurring with probability `\(1/n\)` ] -- .pull-right-narrow[ .red[ **Recall (Lecture 3):** `\(X_i\)` is a **random variable** — it could take many values before we observe the sample `\(x_i\)` is a **realized value** — the specific number we actually observed Uppercase = random; lowercase = realized ] ] -- .pull-left-wide[ - The analogy principle gives us the **sample average** (realized value): `$$\bar{x} = x_1 \cdot \frac{1}{n} + x_2 \cdot \frac{1}{n} + \cdots + x_n \cdot \frac{1}{n}$$` `$$= \sum_{i=1}^n x_i \cdot \frac{1}{n} = \frac{1}{n} \cdot \sum_{i=1}^n x_i$$` ] -- .pull-left-wide[ - Since this can be calculated for any realized sample, we define the **sample average estimator** as: `$$\bar{X} = \frac{1}{n} \cdot \sum_{i=1}^n X_i$$` ] --- # Estimate vs estimator .pull-left-wide[ - `\(\bar{X}\)` is a *random variable*, while `\(\bar{x}\)` is a realized value of `\(\bar{X}\)` ] -- .pull-left-wide[ - `\(\bar{X}\)` is an **estimator**: a random variable that is a function of the sample and aims to replicate a population parameter ] -- .pull-left-wide[ - `\(\bar{x}\)` is an **estimate** (or **estimated value**): a realized value of the estimator, based on a particular sample - The estimate is our guess of the true value of the parameter ] -- .pull-left-wide[ #### Why the distinction? ] -- .pull-left-wide[ - We can now begin to think of questions of the form `\(P(\bar{X} = \bar{x})\)`, which is the probability that the estimator takes a particular value - This is the basis for inference. ] -- .pull-right-narrow[ - Notice any problems here? `\(\bar{X}\)` is a **continuous** random variable. - We usually study questions of the form `\(P(\bar{X} \leq 5)\)` ] --- # .red[Practice 1: The sample average] .pull-left-wide[ Suppose we observe the sample: `\(x_1 = 3,\ x_2 = 7,\ x_3 = 2,\ x_4 = 8,\ x_5 = 5\)`. 1. Calculate the sample average `\(\bar{x}\)` 2. We now draw a new sample of size `\(n = 100\)` from a population with `\(\mu = 5\)` and `\(\sigma^2 = 4\)`. What are `\(E(\bar{X})\)` and `\(Var(\bar{X})\)`? .small123[ *Hint:* `\(E(\bar{X}) = \dfrac{1}{n}\displaystyle\sum_{i=1}^n E(X_i)\)` and `\(Var(\bar{X}) = \dfrac{1}{n^2}\displaystyle\sum_{i=1}^n Var(X_i)\)` ] ] --- class: inverse, middle, center # Properties of estimators --- # Roadmap for the remainder of the lecture .pull-left-wide[ - We have now used the analogy principle to construct an estimator of the mean value: the sample average `\(\bar{X}\)` - But how good is this estimator? How much can we trust it? - ... and can we say anything about its probability distribution function in general? ] -- .pull-left-wide[ - We will derive the classical properties of a 'good' estimator: **unbiasedness**, **efficiency**, and **consistency** - One of these have a special name for the 'average' as an estimator: the **Law of Large Numbers** - We will then proceed to derive the *Central Limit Theorem*, which gives us the distribution of `\(\bar{X}\)` in large samples ] --- # Properties of estimators .pull-left-wide[ - We can construct infinitely many estimators, but we want a *good* one - We need to define what makes an estimator *good*, given that we do not know the true value of the parameter ] -- .pull-left-wide[ - We are generally interested in three properties: - **Unbiasedness:** Our guess is correct on average across all possible samples - **Efficiency:** We leave no information from the sample unused; the estimator is as precise as possible - **Consistency:** The estimator gets closer to the true parameter as the sample size grows — for the sample average this is known as the **Law of Large Numbers** ] --- # Unbiasedness .pull-left-wide[ > An estimator is **unbiased** if its expected value equals the parameter it aims to approximate ] -- .pull-left[ - Suppose we could sample many times and calculate the estimator in each sample - We would want these values to be "around" the true parameter — on average equal to it ] -- .pull-left-wide[ #### Counter example 1. We take 100 samples from a normal distribution and use an estimator 2. Repeat this process 1,000 times to get a distribution of estimates 3. The vertical solid line is the true mean (5), while the dashed red line is the average of the estimates (5.05) *This estimator is **not** unbiased but close* ] .pull-right-narrow[ 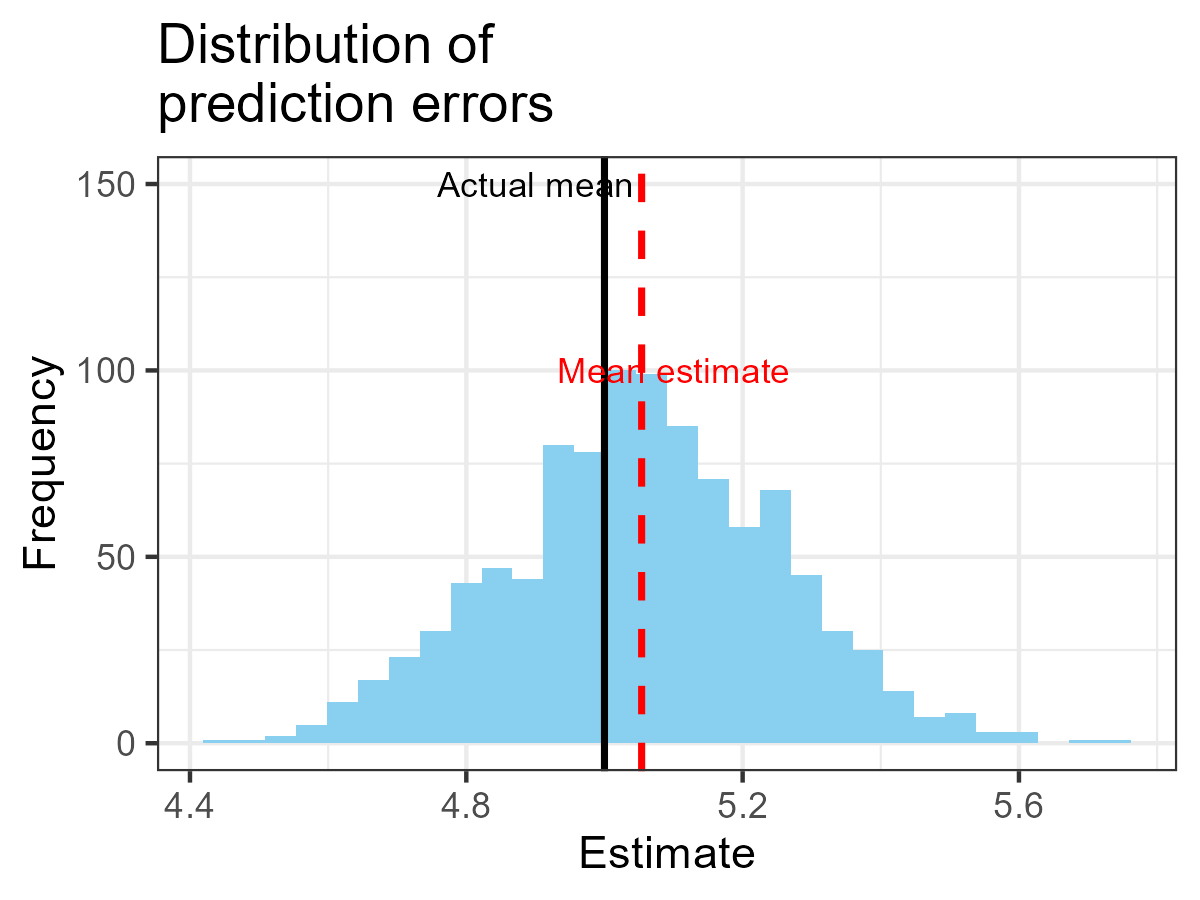 ] --- # Unbiasedness of sample average .pull-left-wide[ `$$\begin{align} E(\bar{X}) &= E\!\left[\frac{1}{n}\sum_{i=1}^n X_i\right] \\[6pt] &= \frac{1}{n} \cdot E\!\left[\sum_{i=1}^n X_i\right] && \text{(constant out)} \\[6pt] &= \frac{1}{n} \cdot \sum_{i=1}^n E(X_i) && \text{(sum of expectations)} \\[6pt] &= \frac{1}{n} \cdot n\mu = \mu && \text{(i.i.d.: } E(X_i)=\mu\text{)} \end{align}$$` ] -- .pull-right-narrow[ .red[ **Intuition:** Some draws land above `\(\mu\)`, some below — they cancel out on average. No systematic over- or underestimation. ] ] --- # Efficiency .pull-left-wide[ - In practice, we cannot resample many times — we usually only have one realized sample ] -- .pull-left-wide[ > An estimator is more **efficient** than another if its variance is smaller ] -- .pull-left[ - Since the estimator is a random variable, its realized value can be far from the parameter even if unbiased - We want its variance to be as small as possible (a *precise* estimator) ] .pull-right[ 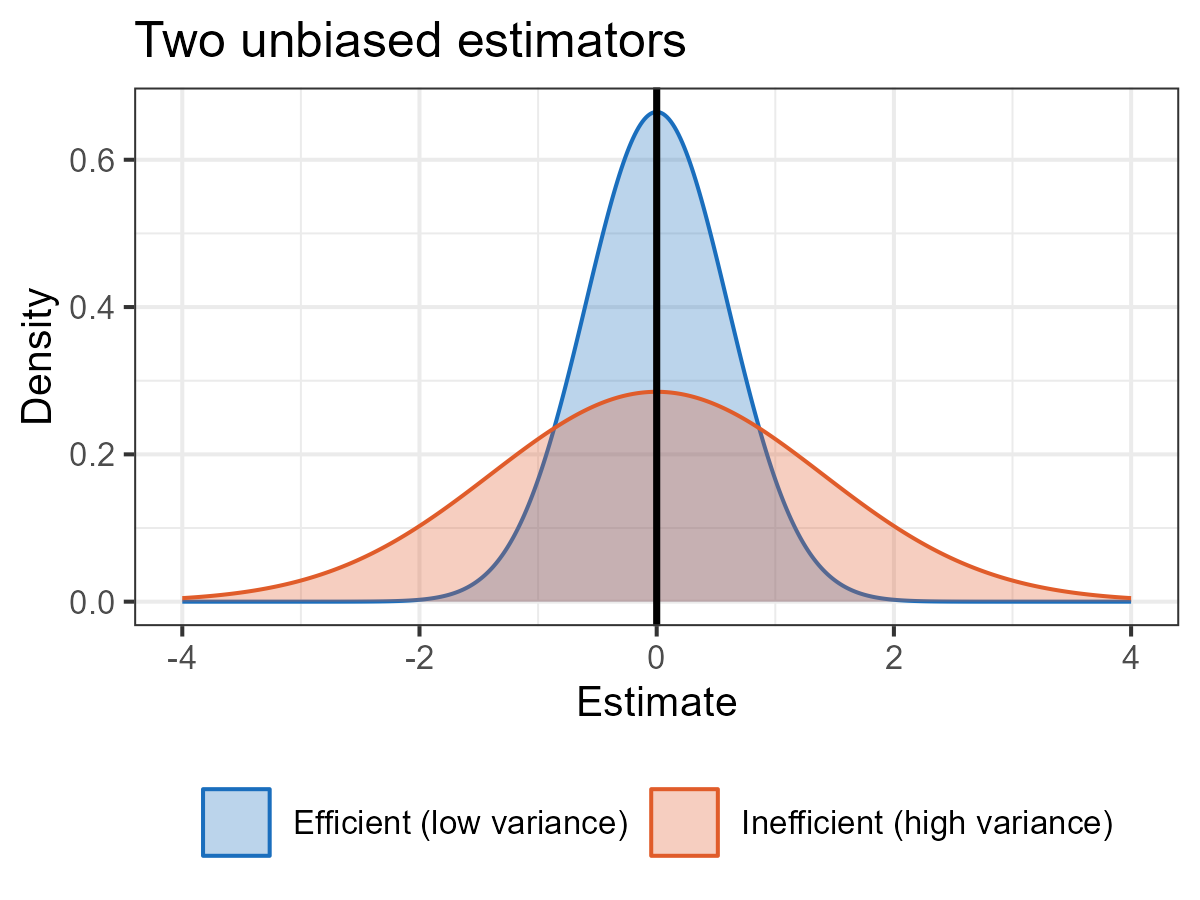 ] --- # Variance of sample average .pull-left-wide[ - Because sample elements are independent, we can calculate the variance directly: `$$Var(\bar{X}) = Var \left[ \frac{1}{n} \sum_{i=1}^n X_i \right] = \frac{1}{n^2} \cdot \sum_{i=1}^n Var(X_i)$$` ] -- .pull-left-wide[ `$$= \frac{1}{n^2} \cdot n \cdot \sigma^2 = \frac{\sigma^2}{n}$$` - The variance of `\(\bar{X}\)` decreases with sample size: the larger the sample, the more precise the estimator ] -- .pull-left-wide[ - *Next semester you will learn about the 'Best Linear Unbiased Estimator' estimator.* - 'Best' means lowest possible variance - Turns out the 'average' is the best linear unbiased estimator of the mean value ] --- # Consistency .pull-left-wide[ > An estimator is **consistent** if it is unbiased and its variance goes to zero as `\(n \to \infty\)` ] -- .pull-left-wide[ - As sample size grows toward infinity, the distribution of the estimator collapses on a single value - If that value equals the true parameter, the estimator is consistent ] -- .pull-left[ - This implies that a consistent estimator will have realized values very close to the true parameter in a "sufficiently large" sample ] .pull-right[ 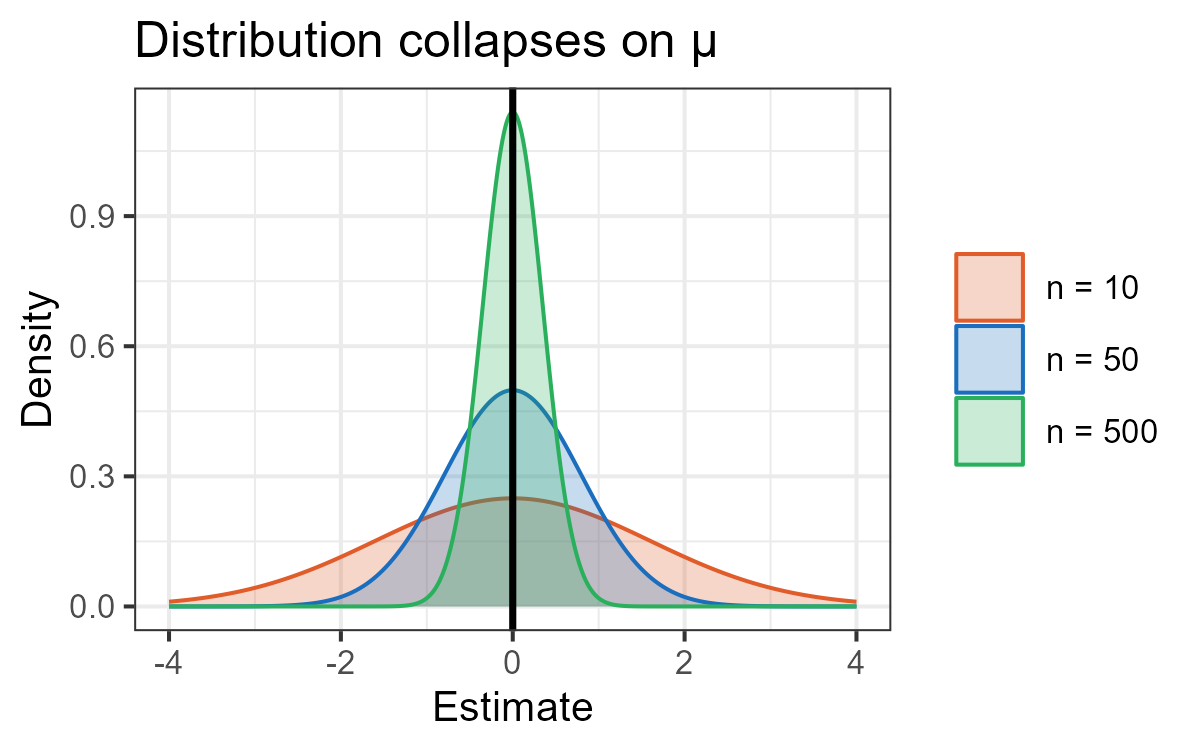 ] --- # Consistency of sample average .pull-left-wide[ - Recall that the sample average is unbiased: `\(E(\bar{X}) = \mu\)` ] -- .pull-left-wide[ - Its variance goes to zero as sample size grows: `$$\lim_{n \rightarrow \infty} Var(\bar{X}) = \lim_{n \rightarrow \infty} \frac{\sigma^2}{n} = 0$$` ] -- .pull-left-wide[ - Therefore, the sample average is a **consistent** estimator of `\(\mu\)` ] --- # Estimators: mixing and matching properties | Estimator | Unbiased? | Efficient? | Consistent? | |:---|:---:|:---:|:---:| | OLS (Gauss-Markov assumptions hold) | ✓ | ✓ | ✓ | | OLS (heteroskedastic errors) | ✓ | ✗ | ✓ | | IV / 2SLS | ✗ | ✗ | ✓ | | OLS (endogeneity) | ✗ | ✗ | ✗ | | First observation `\(X_1\)` only | ✓ | ✗ | ✗ | | Self-selected survey (e.g. opt-in online poll) | ✗ | ✗ | ✗ | -- .orange[ .pull-left-wide[ .small123[ *You will meet all of these estimators in future courses. The point now is that the properties you are learning today — unbiasedness, efficiency, consistency — are exactly what practitioners use to evaluate and choose between estimators.* - **OLS** is the workhorse of econometrics — its position in the table depends entirely on whether the assumptions hold - **IV / 2SLS** is the go-to fix when OLS fails due to endogeneity — it sacrifices some efficiency to restore consistency - **Convenience samples** are a warning: a biased and inconsistent estimator can look convincing but mislead systematically ] ] ] --- # The Law of Large Numbers .pull-left-wide[ > **Law of Large Numbers:** As the sample size `\(n \to \infty\)`, the sample average `\(\bar{X}\)` converges to the true population mean `\(\mu\)` ] -- .pull-left-wide[ **Example 1 — Coin flips.** A fair coin has `\(\mu = 0.5\)`. With `\(n = 10\)` flips the proportion of heads might be 0.3 or 0.7. With `\(n = 10{,}000\)` flips it will be very close to 0.5. The randomness averages out. ] -- .pull-left-wide[ **Example 2 — Wages.** Survey 5 workers: the sample average wage could easily be far from the true national average. Survey 50,000 workers: the sample average will be extremely close to the true average — any one unusual wage is drowned out by the rest. ] -- .pull-left-wide[ **Example 3 — Dice.** Roll a die once: you get a number from 1 to 6. The true mean is 3.5. Roll it 100,000 times and average the results: you will get almost exactly 3.5. ] --- # .red[Practice 2: Properties of estimators] .pull-left-wide[ Consider `\(\tilde{X} = X_1\)` (just the first observation) as an estimator of `\(\mu\)`. 1. Is `\(\tilde{X}\)` unbiased? Show your work. 2. Compare `\(Var(\tilde{X})\)` to `\(Var(\bar{X})\)` for `\(n > 1\)`. Which is more efficient? 3. Is `\(\tilde{X}\)` consistent? Why or why not? ] --- # .red[Raise your hand 2: Estimator properties] <div class="countdown" id="timer_7e722849" data-update-every="1" tabindex="0" style="top:TRUE;right:0;"> <div class="countdown-controls"><button class="countdown-bump-down">−</button><button class="countdown-bump-up">+</button></div> <code class="countdown-time"><span class="countdown-digits minutes">00</span><span class="countdown-digits colon">:</span><span class="countdown-digits seconds">20</span></code> </div> .pull-left-wide[ **Q1.** The sample average `\(\bar{X}\)` is unbiased for `\(\mu\)`. Define `\(\tilde{X} = 2\bar{X}\)`. Is `\(\tilde{X}\)` unbiased for `\(\mu\)`? - **A)** No — `\(E(\tilde{X}) = 2\mu \neq \mu\)`, so it is biased - **B)** It depends on whether `\(\mu > 0\)` - **C)** Yes — it is a function of the sample, so it inherits unbiasedness ] -- .pull-left-wide[ **Q2.** Which statement about consistency is correct? - **A)** Any unbiased estimator is automatically consistent - **B)** Consistency only requires that the estimator's bias goes to zero - **C)** An estimator can be consistent without being unbiased in finite samples ] --- class: inverse, middle, center # The distribution of the estimator `\(\bar{X}\)` --- # Why does the shape of `\(\bar{X}\)` matter? .pull-left-wide[ - We know `\(E(\bar{X}) = \mu\)` and `\(Var(\bar{X}) = \sigma^2/n\)` — but that only tells us the *centre* and *spread* ] -- .pull-left-wide[ - In practice, we want to answer questions like: - *"A central bank surveys 500 firms. What is the probability that the true average inflation expectation across all firms exceeds 2% — enough to justify raising interest rates?"* - *"From 800 sampled workers, what can we say about the gender wage gap across all 3 million workers in the country?"* - These require knowing the **shape** of the distribution of `\(\bar{X}\)` ] -- .pull-left-wide[ - Coming up: The *Central Limit Theorem* — a result so powerful it works **regardless of what the distribution of `\(X\)` looks like** ] -- .pull-right-narrow[ .red[**Key idea**] *Chaos averages into order* No matter how strange the individual outcomes are, their averages always converge to the same universal shape ] --- # The distribution of `\(\bar{X}\)` if sample is normal .red[*First a simpler result*] -- .pull-left-wide[ - Suppose `\(X \sim \mathcal{N}(\mu, \sigma^2)\)`. Then each `\(X_i \sim \mathcal{N}(\mu, \sigma^2)\)`, so: `$$\frac{X_i}{n} \sim \mathcal{N}\left(\frac{\mu}{n}, \frac{\sigma^2}{n^2} \right)$$` ] -- .pull-left-wide[ - As a sum of normally-distributed random variables: `$$\bar{X} = \frac{X_1}{n} + \frac{X_2}{n} + \ldots + \frac{X_n}{n} \sim \mathcal{N}\left(\mu, \frac{\sigma^2}{n} \right)$$` ] -- .pull-left-wide[ > ***Interpretation:*** *If the sample is drawn from a normal distribution, the sample average is also normally distributed.* ] -- .pull-right-narrow[ .red[**But what if the sample is not normal?**] ] --- # The CLT in action .pull-left-narrow[ - We draw samples of size `\(n = 1\)`, `\(n = 2\)`, `\(n = 5\)`, `\(n = 10\)`, `\(n = 30\)`, `\(n = 100\)`, and `\(n = 200\)` from a weird distribution - We take the average - What is the distribution of this average across many samples? ] .pull-right-wide[ .panelset[ .panel[.panel-name[n = 1] .center[  ] ] .panel[.panel-name[n = 2] .center[  ] ] .panel[.panel-name[n = 5] .center[  ] ] .panel[.panel-name[n = 10] .center[  ] ] .panel[.panel-name[n = 30] .center[  ] ] .panel[.panel-name[n = 100] .center[  ] ] .panel[.panel-name[n = 200] .center[  ] ] ] ] --- # The approximate distribution of `\(\bar{X}\)` .pull-left-wide[ - In practice, we will not know the distribution of `\(X\)` — but we have a very powerful result ] -- .pull-left-wide[ > **Central limit theorem** > > Suppose we have a simple random sample `\(X_1, X_2, \ldots, X_n\)` with `\(E(X_i) = \mu\)` and `\(Var(X_i) = \sigma^2\)` for all `\(i\)`. As `\(n \to \infty\)`, the sample mean converges to a normal distribution: > > `$$\bar{X} \overset{a}{\sim} \mathcal{N}\left(\mu, \frac{\sigma^2}{n} \right)$$` - This holds *regardless* of the distribution of `\(X\)` — it is one of the most important results in statistics ] -- .pull-right-narrow[ .small123[ #### More on the CLT - 3Blue1Brown does a good job of explaining how powerfull and widely applicable the CLT is: https://youtu.be/zeJD6dqJ5lo?si=aCQrLf-SJWl8fXyW #### Proving the CLT - The proof is beyond the scope of this course, but it relies on the fact that the moment generating function of `\(\bar{X}\)` converges to that of a normal distribution as `\(n \to \infty\)` - A concise proof is given here: https://youtu.be/nWadI0_u6QU?si=zkzSdGqI9DuUHS0t ] ] --- # .red[Practice 3: The central limit theorem] .pull-left-wide[ Household incomes have mean `\(\mu = 450{,}000\)` DKK and standard deviation `\(\sigma = 120{,}000\)` DKK. We draw a simple random sample of `\(n = 144\)` households. 1. State the approximate distribution of `\(\bar{X}\)`. What are its mean and variance? 2. Using the CLT, approximate `\(F(460{,}000)\)` 3. How does your answer change if `\(n = 36\)`? ] --- # Summary .pull-left-wide[ Central question: **How good is the 'average' as an estimator of `\(\mu\)`?** - **Unbiased**: `\(E(\bar{X}) = \mu\)` — correct on average - **Efficient**: Smallest variance among unbiased linear estimators - **Consistent**: `\(\bar{X} \xrightarrow{p} \mu\)` as `\(n \to \infty\)` (**Law of Large Numbers**) ] -- .pull-left-wide[ **Distribution of `\(\bar{X}\)` (Central Limit Theorem)** For large `\(n\)`, regardless of the population distribution: `$$\bar{X} \overset{a}{\sim} N\!\left(\mu,\, \frac{\sigma^2}{n}\right)$$` ] -- .pull-left-wide[ These properties — unbiasedness, efficiency, consistency — are exactly the criteria used to evaluate estimators in future courses (OLS, IV, and beyond). ] --- # Next time .pull-left[ - Stratified/Cluster, Estimators - .red[Remember, it's on Monday 12:00-14:00 in U168.] ] .pull-right[  ]