class: center, inverse, middle <style>.xe__progress-bar__container { top:0; opacity: 1; position:absolute; right:0; left: 0; } .xe__progress-bar { height: 0.25em; background-color: #808080; width: calc(var(--slide-current) / var(--slide-total) * 100%); } .remark-visible .xe__progress-bar { animation: xe__progress-bar__wipe 200ms forwards; animation-timing-function: cubic-bezier(.86,0,.07,1); } @keyframes xe__progress-bar__wipe { 0% { width: calc(var(--slide-previous) / var(--slide-total) * 100%); } 100% { width: calc(var(--slide-current) / var(--slide-total) * 100%); } }</style> <style type="text/css"> .pull-left { float: left; width: 44%; } .pull-right { float: right; width: 44%; } .pull-right ~ p { clear: both; } .pull-left-wide { float: left; width: 66%; } .pull-right-wide { float: right; width: 66%; } .pull-right-wide ~ p { clear: both; } .pull-left-narrow { float: left; width: 30%; } .pull-right-narrow { float: right; width: 30%; } .tiny123 { font-size: 0.40em; } .small123 { font-size: 0.80em; } .large123 { font-size: 2em; } .red { color: red } .orange { color: orange } .green { color: green } </style> # Statistics ## Introduction ### Christian Vedel,<br>Department of Economics<br>University of Southern Denmark ### Email: [christian-vs@sam.sdu.dk](mailto:christian-vs@sam.sdu.dk) ### Updated 2026-02-05 --- class: middle # Today's lecture .pull-left-wide[ *Getting to know each other, and getting to know what statistics is.* - **Getting acquainted** - **Motivation:** What is statistics and why do we need it? + What is it we do at a university? + How do we obtain/create knowledge? + Can we trust numbers? Spoiler: No + Why do we need statistics? - **Course overview** + What will you learn in this course? - **Practical matters** + Exercises + Exam ] -- .pull-right-narrow[ **Note:** We will cover things you will *not meet again* before the end of the semester and in followup courses. ] --- class: inverse, middle, center # Getting acquainted --- # Who is everyone? .pull-left[ - Economist - freshly minted PhD (2023) - Research at the intersection between machine learning and economic history. - Research on how and why particular places became well-off, using vast amounts of historical (very uncertain) data. - *Statistics is the core methodological concern of all modern quantitative social science* - I teach this and a data science course. - Write me emails: christian-vs@sam.sdu.dk - Office hours? [Who are you? https://forms.office.com/e/4MYaBaswkA](https://forms.office.com/e/4MYaBaswkA) ] .pull-right[  .small123[*PhD defence, 2023-09-25*] ] --- # My own statistics story -- .pull-left-wide[ - I took statistics myself in 2016. I thought it was kinda useless, and in the midterm I had a pretty bad grade. ] -- .pull-left-wide[ - In the second half of the course, I realized why it was useful. ] -- .pull-left-wide[ - I then built my career on that -- now I apply these methods every day in my research. And I get to teach it to you. ] -- .pull-left-wide[ *So bear with me if the first part feels abstract. It will click.* ] --- ## Some problems caught in the wild -- A government proposes raising the minimum wage. Opponents claim it will increase unemployment; supporters claim it will reduce poverty. > How would you figure out who is right? -- You work at a central bank. Interest rates were raised last quarter and inflation fell. Your boss claims the rate hike caused the drop. But inflation was already trending down before the hike. > How would you determine whether the rate hike actually caused lower inflation? -- You work at a consulting firm. A client wants to know if their employee training programme increased productivity. Employees who signed up for training are more productive than those who didn't. > Can you conclude the training worked? -- You work in the ministry of justice. Areas with more police officers tend to have higher crime rates. > Should you recommend that they remove police officers from areas with higher crime rates? --- class: middle # A definition > Statistics is about quantifying what we **know** and what we **don't know** based on some analysis of some data. .footnote[ .small123[ **Note:** In practice this is as much philosophy as it is maths. And increasingly computer science is also involved. In practice innovations come as much from every field that uses it: Social Science, Biology, Economics, Psychology, Business Studies, etc. ] ] --- class: inverse, middle, center # What is statistics and why do we need it? --- class: middle .pull-left-wide[ # What is it we do at uni? (1/3) - Why did you choose your line of study? - **Interest:** Why do you think it is interesting? - **Function:** How are you planning on using what you learn? E.g. what kind of job (loosely speaking) do you hope to have in ~10 years time? ] --- class: middle # What is it we do at uni? (2/3) ### The legal answer **Executive Order on Bachelor's and Master's Programs at Universities (Education Executive Order):** > "Section 2: The purpose of bachelor's degree programs is to: > [...] Provide the student with the academic knowledge and theoretical and **methodological qualifications and competencies**, enabling them to independently identify, formulate, and solve complex problems within the relevant components of the field(s) of study [...]" .small123[[*BEK nr 1328 af 15/11/2016* - chatGPT translation](https://www.retsinformation.dk/eli/lta/2016/1328)] --- class: middle .pull-left-wide[ # What is it we do at uni? (3/3) ### A pragmatic answer - We don't teach you a lot of practical knowledge. Sometimes we do anyway as a happy accident. - We teach you methods and frameworks - We try to equip you with tools to have some expertise in navigating a complex world (in your particular sub-field) - Importantly: You need tools to generate new knowledge. Statistics provides some of the most important such tools. - Also: Makes you capable of reading and engaging with a lot of scientific literature. ] --- class: middle # How do we obtain/create knowledge? (1/4) .pull-left-wide[ > A. *"If you torture the data long enough, it will confess to anything"* (Attributed to Ronald Coase, 1961) > B. *"It is better to be vaguely right than exactly wrong."* (Carveth Read, 1920) > C. *"We do not know; we can only guess."* (K. Popper, 1934) > D. *"For every complex problem there is an answer that is clear, simple, and wrong."* (Mencken, 1916) **Exercise:** Please explain, for the above quotes, the opportunities and limitations that they impose on knowledge creation in social science. ] --- # How do we obtain/create knowledge? (2/4) ### An analogy of doing social science with statistics > *"Studying societies and people is like standing in a dark room, throwing darts into empty space. If one hits something, we then argue endlessly over what was hit, what the dart really is, and whether we ever threw it in the first place."* - Social science is *hard* -- - Two paths forward: 1. Drop the idea of learning anything specific: Everything is endlessly complex, and the only task is to appreciate this 2. Cautious positivism: Pose certain ideas and then test them in data. Eventually we learn something. At least something which is (locally) useful. -- *Econ is often firmly in the second camp* --- class: middle # How do we obtain/create knowledge? (3/4) .pull-left-wide[ ### Some hard questions to answer 1. What will happen to living standards if the current rules based order collapses? 2. Does higher education cause higher income? 3. Does joining the EU cause more prosperity for a society? 4. Does more internal EU migration benefit the EU on aggregate? Who wins and who loses out? 5. Was brexit a good idea? 6. Is it a good idea for a company to focus on CSR? 7. Can you boost employee retention with training programmes? What about productivity? 8. Does increased advertising cause more sales? 9. Is it beneficial for a company to have more diverse management? 10. What places will be prosperous after climate change? ] --- class: middle # How do we obtain/create knowledge? (4/4) .pull-left[ ### How it ought to be *How we often assume it is in intro stats* - You have some idea about how to measure something - You collect data - You test whether the data lends support to your idea - You conclude or start over by collecting more data ] .pull-right[ ### How it often is *The lived experience* - You have some data - You are asked to provide 'insights' - You start wondering about the type of questions you can answer - You test these ideas - Your results are inconclusive - Your boss demands that you make a conclusion anyway and move on to the next project. ] ***Note:*** *In this course we will start in a nice and simplified world and then the complexity follows in further courses.* --- class: middle # Can we trust numbers? .pull-left-wide[ - Generally: No - But there are degrees. - A strict statistical analysis can provide valuable insights. - E.g. we can know whether painkillers work against headaches. - **Point of this course:** To introduce you to the basic theoretical framework to evaluate whether you can trust a number or not. ] --- class: middle # Why do we need statistics? .pull-left-wide[ - We need to study statistics, because it provides tools for generating new knowledge and evaluating the validity of existing claims. - In turn this is part of providing you with one of the main takeaways from a university education: Tools to enable you to obtain new knowledge, scientifically and independently - Statistics is hard. But knowledge creation is generally hard. But also valuable. - **Pragmatically:** You have a lot of courses that builds on this. Regression Analysis, Econometrics, Finance, Macro, Micro, etc. ] --- class: middle # Kahoot! *If we can get it to work* --- # Causation vs correlation .pull-left[ - In economics (and econometrics), we are primarily concerned with *causality*: > Does `\(A\)` cause `\(B\)`? If we can make `\(A\)` happen, can we generally obtain `\(B\)` as a result? ] -- .pull-left[ **Very important distinction between causality and correlation:** > A study conducted by ophthalmologists at the University of Pennsylvania (and published in May 1999 in *Nature*) found that leaving night lights on is strongly associated with myopia in children → "night lights cause myopia" ] -- .pull-left[ **A follow-up study, also published in *Nature* (in March 2000) found different results** > Myopic parents are more likely to leave night lights on (for themselves, not for the children!). Myopia is usually transmitted from parents to children ] -- .pull-right-narrow[ > Imagine the consequences of such mistakes when advising on monetary policy, unemployment, cancer treatments, etc.!! ] --- class: middle # Ice cream & drowning .pull-left-wide[ - [Ice_cream_kills.xlsx]() - Eating before swimming is dangerous! (Or is it?) ] --- # Why study statistics? .center[ 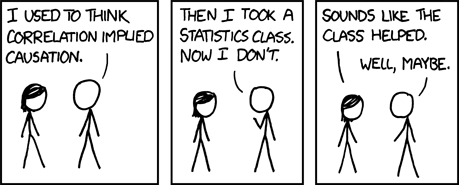 .small123[ Source: xkcd.com (http://xkcd.com/552/) ] ] --- class: inverse, middle, center # About the course --- class: middle .pull-left-wide[ # How will we study statistics? - We will start with the basics and then make our way up: - what is a random variable? - how do we characterize random variables? - how do we use random variables to test hypotheses? - The course includes lectures and tutorials: - lectures: - Tuesdays, 8am--10am in U81 - Wednesdays, 10am--12pm in U81 - tutorials, 2 hours per week - Let's checkt he course plan on ItsLearning - Plan on ItsLearning is guide only - We may progress faster or slower ] --- class: middle # Course materials .pull-left-wide[ - Main textbook: - "An Insight Into Statistics," by Nikolaj Malchow-Møller and Allan Würtz **Note:** You are strongly advised to read the relevant chapters from the main textbook to ensure concepts are clear. The chapters for each lecture is indicated in the lecture plan on ItsLearning. - Course materials: - course page on ItsLearning: check regularly for announcements or new course materials - lecture notes - problem sets (and solutions at the end of the semester) ] --- class: middle # Course description [Let's have a look*](https://odin.sdu.dk/sitecore/index.php?a=fagbesk&id=199940&listid=40501&lang=en) .footnote[ .small123[*It's a link. You can click it.] ] --- class: middle # Tutorials .pull-left-wide[ - Tutorials (discussion sessions) will be conducted as follows: - a problem set will be posted on ItsLearning the week before the tutorial - you need to solve the exercises and bring your solutions to the tutorial - the TA will discuss some of the "official" solutions and answer your questions - TA will introduce you to R in the earlier tutorials of the course - The lectures and tutorials are *the best preparation* for the exam → you are *strongly* encouraged to participate ] --- # How will we study statistics? - Evaluation -- your grade will come from two parts: 1. Mid-term Exam (40%): - conducted on the computer - individual - 2026-03-19 (more info to follow) 2. Final written exam (60%): - conducted on the computer - individual - exact time and place TBD - You need to pass (i.e., have a grade of at least 02) *both* parts in order to pass the course - **Note:** R is introduced to you for use in future courses. Assessment in this course is not based on R. --- # Points of contact If you have any questions about the course administration please look through the course description first. Most answers should be here. If you still have an unanswered question: -- 1. **Study Board:** Information about course administration, any type of exemptions, exam dates and regulations etc. -- 2. **Teaching Assistant:** Questions regarding R and solutions to exercise sets. -- 3. **Lecturer:** Substantive questions about topics covered in the lecture. --- class: inverse, middle, center # Introduction to data concepts --- # Data .small123[*You probably know this. But it is still important to define terms. I will refer to these and expect you to know them.*] .pull-left[ - Data is a collection of structured information - Typically (and often good practice): + **Observations** (each row is an **entity**) and + **information** (each column is a **variable** containing information) ] -- .pull-left[ - **Observation**: Person, company, municipality, parish, country, etc. (these are referred to as 'entities') - **Variable**: Information about that person ] -- .pull-left[ - **Information**: 120k (annual income), "female", 5 stars ] --- # Example | Observation | Price | Location | Size | Building Rating | |-----------------|-------|--------------|--------|-----------------| | House 1 | 250k | Suburb | 120 sqm| A | | House 2 | 350k | City Center | 80 sqm | C | | House 3 | 450k | Suburb | 150 sqm| B | -- .center[ **What type of information can variables be?** ] --- # Types of variables .pull-left[ ### Quantitative variables - Nominal scale: + House price, income, years of education - Ordinal scale: + Reviews (1, 2, ..., 5 stars), + Building rating (A, B, C), + etc. ] -- .pull-right[ ### Qualitative variables - House color: "Red" - Location: "Suburban" - Tone of language: "Positive" **Note:** We can turn this into something quantitative anyway. + Dummy: Mark all "red" buildings with 1 and the rest with 0 + Grouped statistics: Calculate the mean house price for each type of location ] --- # Samples .pull-left[ - We want to know something about the world - But we don't have data on all of it - We want to **infer** something about the **population** from a **sample** of it. - **Note 1:** Depending on what we measure, the idea of a 'population' might be abstract: + Example 1: Average weight of newborn babies in 2024 `\(\rightarrow\)` Population: All babies in 2024 + Example 2: Company responses to a survey `\(\rightarrow\)` Population: This company? Similar companies? - **Note 2:** We can only know something about the average for the population. Not the individuals (unless everyone is the same) ] .pull-right[ 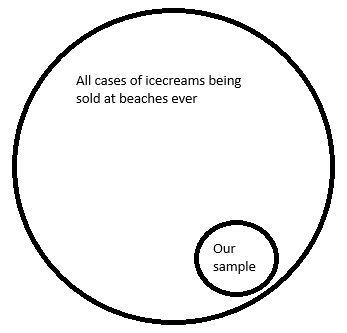 ] --- # Sampling in practice .pull-left[ - **Q**: Can you know something without asking everyone? + **A**: Sometimes. You will learn when/why (*Central Limit Theorem, Law of Large Numbers*) + Note: Do you need to measure all apples to know what an apple weighs on average? - **Q**: What do we need to assume? + Generally: The sample needs to be IID (independently identically distributed) + But we can work with exceptions ] .pull-right[ .small123[https://x.com/LowKickLuke/status/1884450622868504890] .center[ <img src="Figures/Sampling_in_practice.png" alt="Greenland" width="350"/> ] ] --- # Different types of sources .pull-left[ ## 1. Primary ### 1.a. Experimental - When you run an experiment and can control all the conditions - E.g. lab experiment ### 1.b. Observational - When you observe the data and can control that - E.g. survey data ] .pull-right[ ## 2. Secondary (what we often work with) - Data just happens to exist for some reason - We use it to explore (social) scientific questions - E.g. Register data, public databases, *archival data* ] --- # Before next time .pull-left[ - Read the assigned reading - Next time: Uncertainty and probability `\(\rightarrow\)` Chapter 3 ] .pull-right[  ]