Data science for security
Bennett Kleinberg
25 Oct 2019

Today
- The big promise: A primer of data science
- The pitfalls and problems
- Data Science for security
(if we have time: The do-or-die problem of data science)
Your thoughts?
- More data = better problem solving.
- Every problem will become a “data problem”.
- The big challenge for data science is a technological one.
Aaah: so we’re talking Big Data!

Problems with “Big Data”
- what is “big”?
- data = data?
- complexity of data?
- sexiness of small data
Before we start
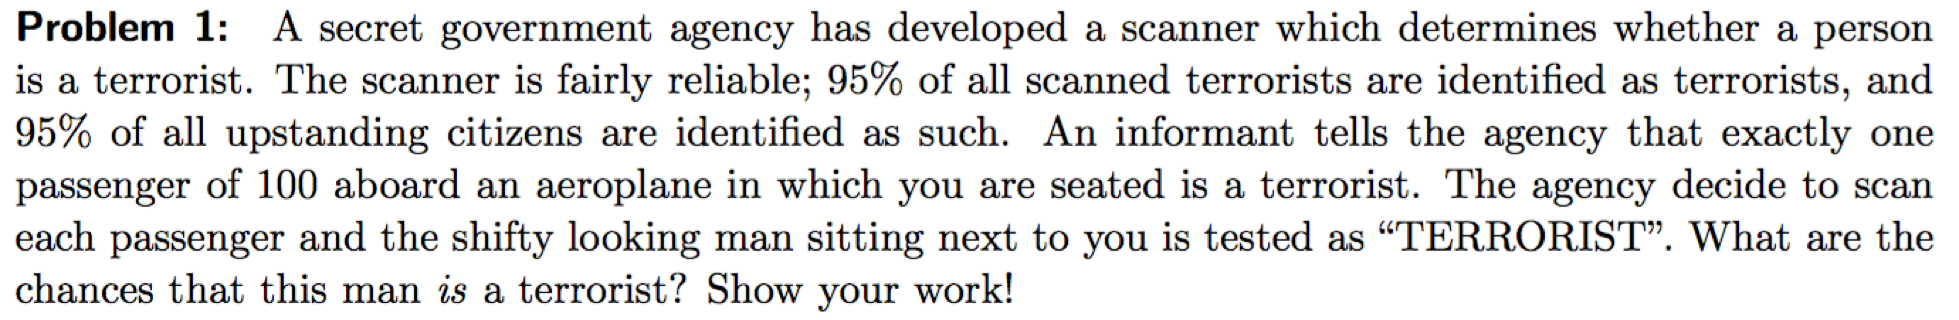
What are the chances that this man is a terrorist?
The big promise: A primer of data science
Machine learning?
- core idea: a system learns from experience
- no precise instructions
Applications?
Why do we want this?
Step back…
How did you perform regression analysis in school?
Okay …
- you’ve got one outcome variable (e.g. number of shooting victims)
- and two predictors (e.g. gender of shooter, age)
- typical approach \(victims = gender + age\)
- regression equation with: intercept, beta coefficients and inferred error term
But!
Often we have no idea about the relationships.
- too many predictors
- too diverse a problem
- simply unknown
ML in general
- concered with patterns in data
- learning from data
- more experience results typically in better models
- data, data, data
Types of machine learning
Broad categories
- Supervised learning
- Unsupervised learning
- Hybrid models
- Deep learning
- Reinforcement learning
Deep learning
Inspired by the human brain.
- MIT’s course website https://deeplearning.mit.edu/
- Lex Fridman’s courses from MIT –> YouTube
Reinforcement learning
- Excellent YouTube examples from code bullet
- e.g. AI Learns to play the Worlds Hardest Game
SUPERVISED LEARNING
What is supervised?
- who is the supervisor?
- supervised = labelled data
- i.e. you know the outcome
- flipped logic
Contrary: unsupervised.
Classes of supervised learning
- classification (e.g. death/alive, fake/real)
- regression (e.g. income, number of deaths)
Mini example
Supervised classification
Simple example
- gender prediction
- based on salary
| gender | salary |
|---|---|
| male | 33796 |
| male | 34597 |
| male | 34296 |
| male | 32262 |
| female | 19190 |
| female | 14424 |
| female | 37614 |
| female | 29079 |

How to best separate the data into two groups?
Core idea
- learn relationship between
- outcome (target) variable
- features (predictors)
- “learning” is done through an algorithm
- simplest algorithm:
if A then B
- simplest algorithm:
Idea 1: male salary threshold

Idea 1: male salary threshold

Idea 2: female salary threshold

Idea 2: female salary threshold

But this is not learning!
Stepwise supervised ML
- clarify what
outcomeandfeaturesare - determine which classification algorithm to use
- train the model
Enter: caret
library(caret)- excellent package for ML in R
- well-documented website
- common interface for 200+ models
caret in practice

caret in practice
my_first_model = train(gender ~ .
, data = data2
, method = "svmLinear"
)Now you have trained a model!
= you have taught an algorithm to learn to predict gender from salary & height

But now what?
Put your model to use
Make predictions:
data2$model_predictions = predict(my_first_model, data2)| female | male | |
|---|---|---|
| female | 8 | 2 |
| male | 3 | 7 |


The key challenge?
Think about what we did…
Problem of inductive bias
- remember: we learn from the data
- but what we really want to know is: how does it work on “unseen” data
How to solve this?
Keep some data for yourself
Train/test split
- split the data (e.g. 80%/20%, 60%/40%)
- use one part as TRAINING SET
- use the other as TEST SET
training_data = data2[ in_training,]
test_data = data2[-in_training,]| gender | salary | height | |
|---|---|---|---|
| 3 | male | 33225 | 179 |
| 9 | male | 40841 | 193 |
| 11 | female | 15039 | 152 |
| 20 | female | 30597 | 148 |
Pipeline again
- define outcome (DONE)
- define features (DONE)
- build model (DONE)
- but this time: on the TRAINING SET
- evaluate model
- this time: on the TEST SET
Teach the SVM:
my_second_model = train(gender ~ .
, data = training_data
, method = "svmLinear"
)Fit/test the SVM:
model_predictions = predict(my_second_model, test_data)| female | male | |
|---|---|---|
| female | 2 | 0 |
| male | 0 | 2 |
But!
- our model might be really dependent on the training data
- we want to be more careful
- Can we do some kind of safeguarding in the training data?
Cross-validation
K-fold cross-validation

How do we know whether a model is good?
Model performance metrics
Example: 400 fake/real news articles:
| Prediction | |||
|---|---|---|---|
| Fake | Real | ||
| Reality | Fake | 159 | 41 |
| Real | 42 | 158 |
How do you evaluate that model?
(159+158)/400 = 0.73
Intermezzo
The confusion matrix
Confusion matrix
| Fake | Real | |
|---|---|---|
| Fake | True positives | False negatives |
| Real | False positives | True negatives |
Confusion matrix
- true positives (TP): correctly identified fake ones
- true negatives (TN): correctly identified real ones
- false positives (FP): false accusations
- false negatives (FN): missed fakes
OKAY: let’s use accuracies
\(acc=\frac{(TP+TN)}{N}\)
Any problems with that?
Accuracy
| Fake | Real | |
|---|---|---|
| Fake | 252 | 48 |
| Real | 80 | 220 |
| Fake | Real | |
|---|---|---|
| Fake | 290 | 10 |
| Real | 118 | 182 |
Problem with accuracy
- same accuracy, different confusion matrix
- relies on thresholding idea
- not suitable for comparing models (don’t be fooled by the literature!!)
Needed: more nuanced metrics
The problem from the beginning:
What are the chances that this man is a terrorist?
Formalising the problem
Probability of TERRORIST given that there is an ALARM
Looking for: P(terrorist GIVEN alarm)
Formal: P(terrorist|alarm)
Solving the problem
| Terrorist | Passenger | ||
|---|---|---|---|
| Terrorist | 950 | 50 | 1,000 |
| Passenger | 4,950 | 94,050 | 99,000 |
| 5,900 | 94,100 | 100,000 |
P(terrorist|alarm) = 950/5900 = 16.10%
Beyond accuracy
## prediction
## reality Fake Real Sum
## Fake 252 48 300
## Real 80 220 300
## Sum 332 268 600## prediction
## reality Fake Real Sum
## Fake 290 10 300
## Real 118 182 300
## Sum 408 192 600Precision
How often is the prediction correct when predicting class X?
Note: we have two classes, so we get two precision values
Formally:
- \(Pr_{fake} = \frac{TP}{(TP+FP)}\)
- \(Pr_{real} = \frac{TN}{(TN+FN)}\)
Precision
## prediction
## reality Fake Real Sum
## Fake 252 48 300
## Real 80 220 300
## Sum 332 268 600- \(Pr_{fake} = \frac{252}{332} = 0.76\)
- \(Pr_{real} = \frac{220}{268} = 0.82\)
Comparing the models
| Model 1 | Model 2 | |
|---|---|---|
| \(acc\) | 0.79 | 0.79 |
| \(Pr_{fake}\) | 0.76 | 0.71 |
| \(Pr_{real}\) | 0.82 | 0.95 |
Recall
How many cases of class X are detected?
Note: we have two classes, so we get two recall values
Also called sensitivity and specificity!
Formally:
- \(R_{fake} = \frac{TP}{(TP+FN)}\)
- \(R_{real} = \frac{TN}{(TN+FP)}\)
Recall
## prediction
## reality Fake Real Sum
## Fake 252 48 300
## Real 80 220 300
## Sum 332 268 600- \(R_{fake} = \frac{252}{300} = 0.84\)
- \(R_{real} = \frac{220}{300} = 0.73\)
Comparing the models
| Model 1 | Model 2 | |
|---|---|---|
| \(acc\) | 0.79 | 0.79 |
| \(Pr_{fake}\) | 0.76 | 0.71 |
| \(Pr_{real}\) | 0.82 | 0.95 |
| \(R_{fake}\) | 0.84 | 0.97 |
| \(R_{real}\) | 0.73 | 0.61 |
Combining Pr and R
The F1 measure.
Note: we combine Pr and R for each class, so we get two F1 measures.
Formally:
- \(F1_{fake} = 2*\frac{Pr_{fake} * R_{fake}}{Pr_{fake} + R_{fake}}\)
- \(F1_{real} = 2*\frac{Pr_{real} * R_{real}}{Pr_{real} + R_{real}}\)
F1 measure
## prediction
## reality Fake Real Sum
## Fake 252 48 300
## Real 80 220 300
## Sum 332 268 600- \(F1_{fake} = 2*\frac{0.76 * 0.84}{0.76 + 0.84} = 2*\frac{0.64}{1.60} = 0.80\)
- \(F1_{real} = 2*\frac{0.82 * 0.73}{0.82 + 0.73} = 0.78\)
Comparing the models
| Model 1 | Model 2 | |
|---|---|---|
| \(acc\) | 0.79 | 0.79 |
| \(Pr_{fake}\) | 0.76 | 0.71 |
| \(Pr_{real}\) | 0.82 | 0.95 |
| \(R_{fake}\) | 0.84 | 0.97 |
| \(R_{real}\) | 0.73 | 0.61 |
| \(F1_{fake}\) | 0.80 | 0.82 |
| \(F1_{real}\) | 0.78 | 0.74 |
UNSUPERVISED LEARNING
- often we don’t have labelled data
- sometimes there are no labels at all
- core idea: finding clusters in the data
Examples
- grouping of online ads
- clusters in crime descriptions
- …
Practically everywhere.
Clustering reduces your data!

The unsupervised case
You know nothing about groups inherent to the data.

The k-means idea
- separate data in set number of clusters
- find best cluster assignment of observations
Stepwise
- set the number of clusters
- find best cluster assignment
1. no. of clusters
Let’s take 4.
unsup_model_1 = kmeans(data4
, centers = 4
, nstart = 10
, iter.max = 10)What’s inside?


The k-means algorithm
- find random centers
- assign each observation to its closest center
- optimise for the WSS
What’s problematic here?
But how do we know how many centers?
Possible approach:
- run it for several combinations
- assess the WSS
- determine based on scree-plot
Cluster determination
wss = numeric()
for(i in 1:20){
kmeans_model = kmeans(data4, centers = i, iter.max = 20, nstart = 10)
wss[i] = kmeans_model$tot.withinss
}Scree plot (elbow method)
Look for the inflexion point at center size i.

Other methods to establish k
- Silhoutte method (cluster fit)
- Gap statistic
See also this tutorial.
Choosing k
We settle for \(k = 2\)
unsup_model_final = kmeans(data4
, centers = 2
, nstart = 10
, iter.max = 10)Plot the cluster assignment

Other unsupervised methods
- k-means (today)
- hierarchical clustering
- density clustering
Issues with unsupervised learning
What’s lacking?
What can you (not) say?
Caveats of unsup. ML
- there is no “ground truth”
- interpretation/subjectivity
- cluster choice
Interpretation of findings
Interpretation of findings
unsup_model_final$centers## salary height
## 1 0.6869085 0.6101199
## 2 -0.8395549 -0.7457021- Cluster 1: low salary, small
- Cluster 2: high salary, tall
Note: we cannot say anything about accuracy.
See the k-NN model.
Interpretation of findings
- subjective
- labelling tricky
- researchers choice!
- be open about this
Pitfalls and problems
Bias
Remember supervised learning?
What is the essential characteristic of it?
Suppose …
… you have to predict the quality of song lyrics.
How would you do it?
Examples
- quality of a football match
- attractiveness of an area
- quality of your degree
Bias through labelled data
- machine learning is only the tool!
- supervised learning will always predict something
- you need the researcher’s/analyst’s mindset to interpret it
Basic principle: BS in = BS out.
Problematic trends
Problematic trends
Problematic trends

Problematic trends
Assumptions, assumptions, assumptions, assumptions, assumptions, assumptions, assumptions, assumptions, assumptions, assumptions, assumptions, assumptions, assumptions, assumptions, assumptions, assumptions, assumptions, assumptions, assumptions. Everywhere assumptions.
The naivité fallacy

The naivité fallacy
The naivité fallacy

The naivité fallacy
Put simply: you can sell anything.
Here’s an idea
ai_terrorism_detection = function(person){
person_classification = 'no terrorist'
return(person_classification)
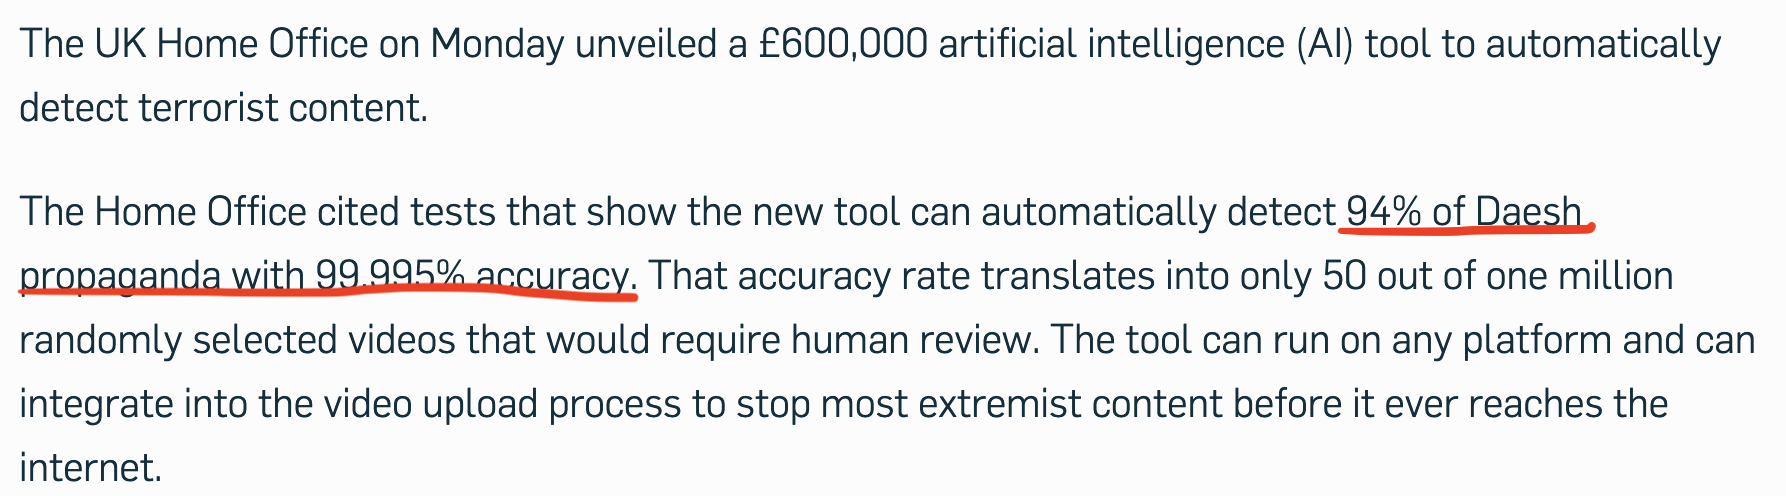
}“UCL RESEARCHERS USE AI TO FIGHT TERRORISM!”
“AI 99.9999% ACCURATE IN SPOTTING TERRORISTS!”
The category mistake of data science
Category mistake
- So we are getting there with self-driving cars.
- Hence: we can also address the other challenges.
!!!!
Category mistake

“I would not be at all surprised if earthquakes are just practically, inherently unpredictable.”
Category mistake
- Building a sophisticated visual recogntion system != predicting everything
- Static phenomena vs. complex systems
Human behaviour might be the ultimate frontier in prediction.
Ethical issues
- data sources
- (machine) learning systems
- reinforcing systems
- responsible practices
Ethics & data science
Your turn: do you see problems for these aspects?
- data sources
- (machine) learning systems
Ethics & data science
What about “reinforcing systems”?
Ethics & data science
Choose 1:
- FP/FN issue in the hand of practitioners
- academics’ responsibility
An outlook
What would an ideal Data Science look like?
Be specific…
Academic data science
vs
“Industry” data science
Question: which one is leading?
Extreme view:
current academic data science is catering hype to compensate the Google envy.

Academic data science
| What it is doing | What it should be doing |
|---|---|
| creating “cool” studies | testing assumptions |
| pumping out non-reproducible papers | investing in fundamental data science research |
| hiring people to do cool things with our data | starting with the problem |
| getting on the data science train | focus on methods of data science |
Outlook
- we need boring studies!
- longitudinal studies
- assumption checks
- replications
- we need to accept that Google & Co. are a different league in applying things
- we need to focus on the “ACADEMIC” part
- we need unis as control mechanism, not as a player
Data science for security
Where can data science help?
Using data science
- Automating human work
- Exceeding human capacity
- Augmenting human decision-making
Automating human work
Examples:
- scanning images for guns
- moderating content on social media
- access control to buildings
Automating human work
Why?
- reliability
- costs per unit
- scalability
Exceeding human capacity
Examples:
- remote sensing applications
- deception detection
- tumor detection
Exceeding human capacity
Why?
- processing capacity problem
- complex relationships
- limited attention of humans
Augmenting human decision-making
Human-in-the-loop systems:
- ML system makes a decision
- Human revises the decision
- Final decision reached
Augmenting human decision-making
Why?
- uses best of both worlds
- context (human) + scale (machine)
- allows your system to gain traction
The biggest problem for data science
Everything is matter
Everything can be measured
Everything can be represented in data

Pep the super data scientist
Pep the super data scientist
- knows everything about football
- knows what happens if you hit a ball from angle X from distance Y at speed Z, etc.
- knows everything about the physiology of the players, about the physical properties of the ball, about the rules
- has got access to all the data that you can possibly collect from a football game
But:
- Pep experiences the world from an isolated room…
- … through his python editor…
- … and only has access to the data
… and never saw a football match.
- Put differently: Pep knows everything about football but has never experienced it
- Pep is thrilled by Cristiano Ronaldo and Lionel Messi
- And has all their data
(Adaptation from The Knowledge Argument / Mary’s Room by Frank Jackson, 1982)
One day …
One day, Pep goes out to the ”real” world and watches a match between Juventus (C. Ronaldo) and Barca (Messi).
Will Pep learn anything?
What does this mean?
- Qualia problem
- Originates from the philosophy of mind (consciousness problem)
- But reaches far beyond that
Pep’s problem & security
- perception of security
- experience of security
- perception of fairness
Recap
- Fastest intro to ML
- Some problems and pitfalls of data science
- Possible applications in security problems
- The hard problem of data science
If you only read one book in 2019…
Read: “The Signal and the noise”, Nate Silver
