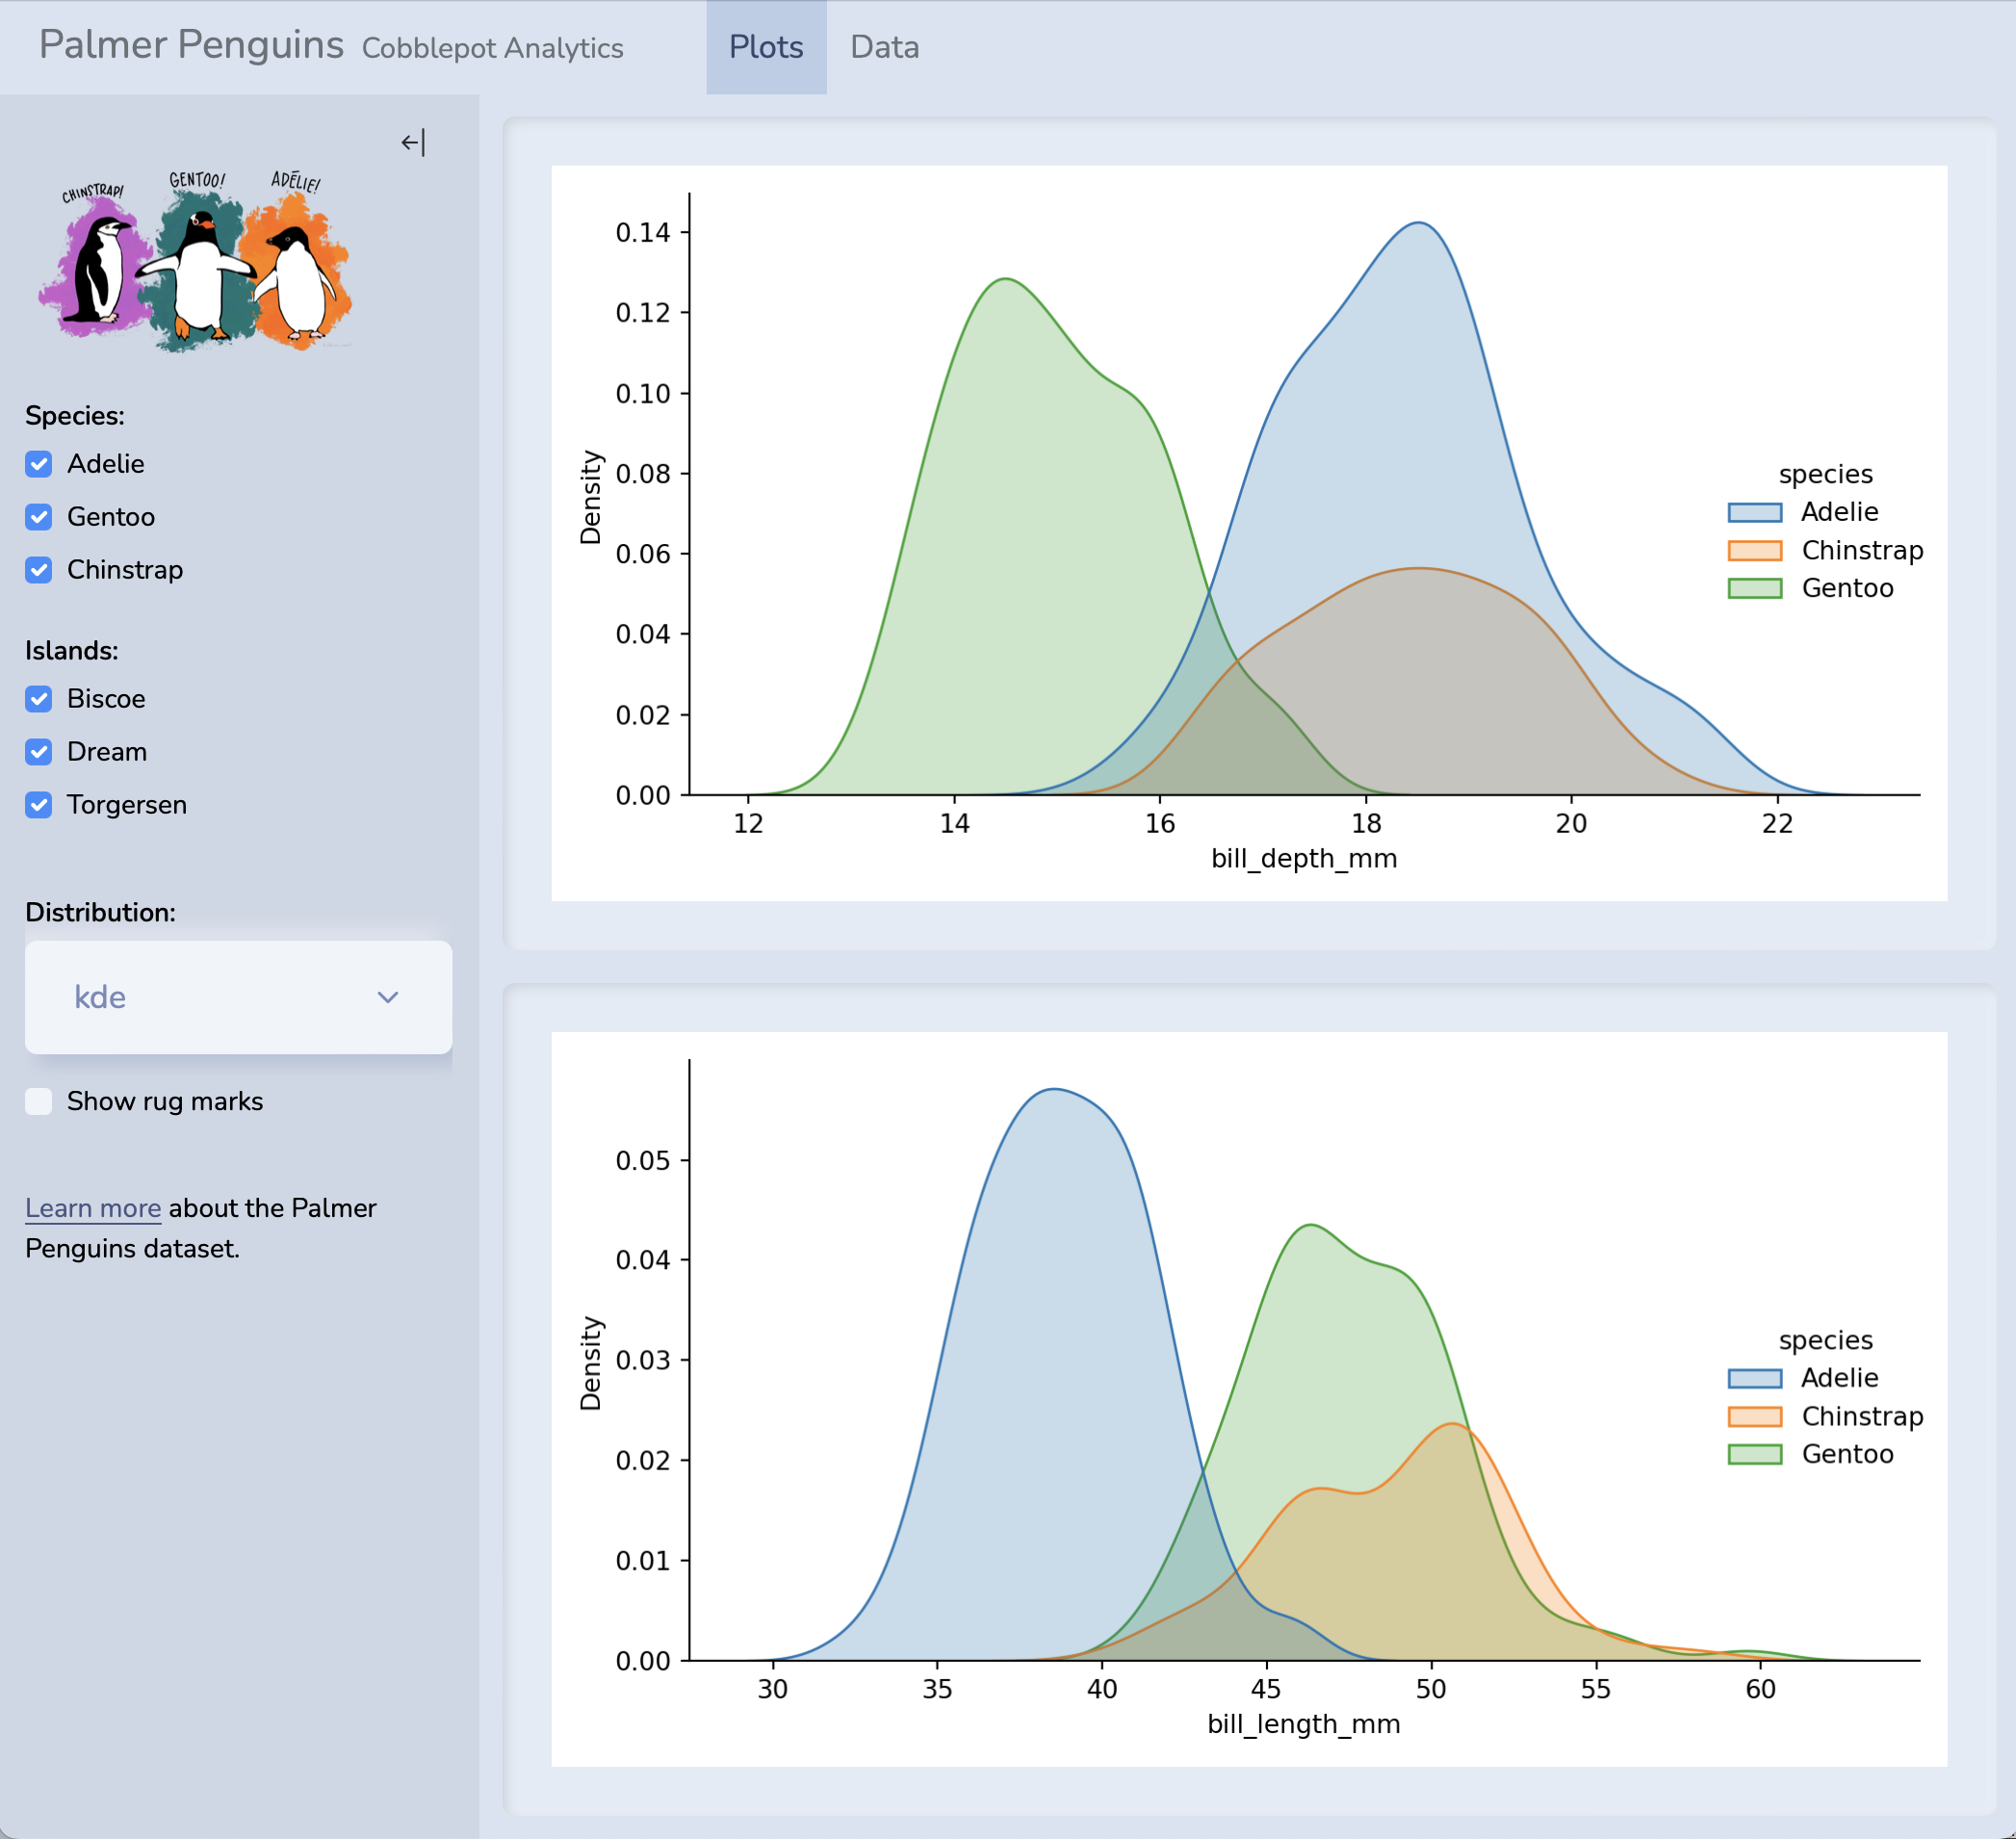
```{python}
#| layout-ncol: 2
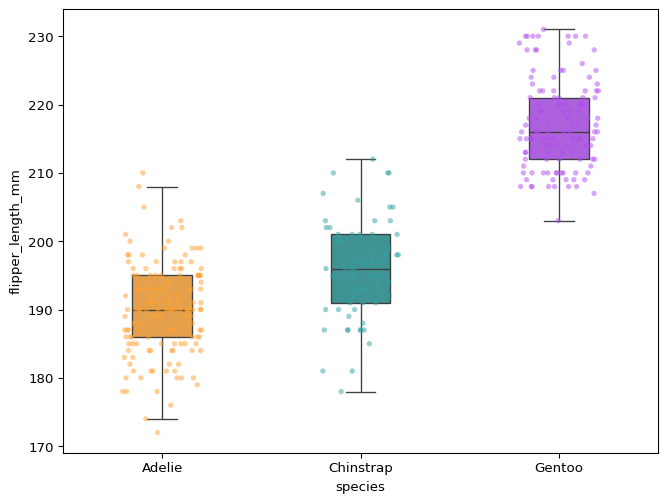
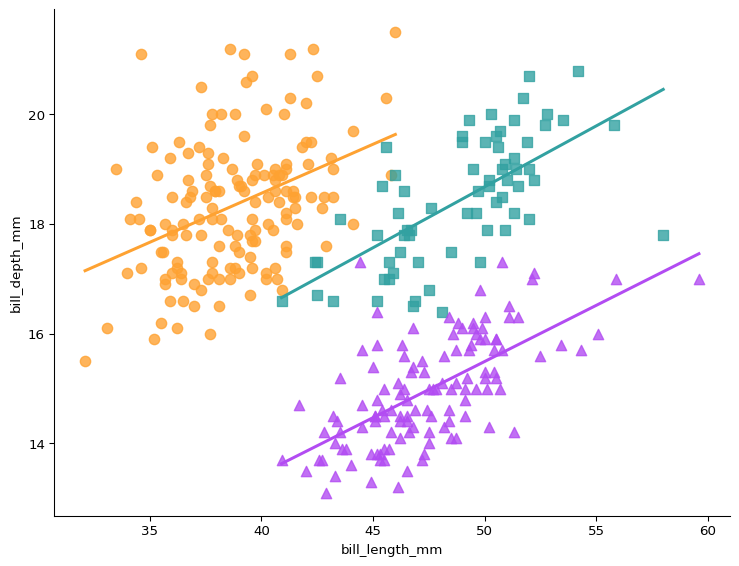
#| fig-cap: ["Boxplot", "Scatter"]

import seaborn as sns
import matplotlib.pyplot as plt

df = sns.load_dataset("penguins")
cols = ["#FEA232", "#32A1A1", "#B24CF2"]

plt.figure(figsize=(8, 6))
sns.boxplot(data=df, x="species", y="flipper_length_mm", width=0.3, palette=cols, showfliers=False)
sns.stripplot(data=df, x="species", y="flipper_length_mm", palette=cols, jitter=0.2, alpha=0.5, size=4)

sns.lmplot(data=df, x="bill_length_mm", y="bill_depth_mm", hue="species", palette=cols,
               markers=['o', 's', '^'], ci=None, height=6, aspect=1.3, legend=False,
               scatter_kws={"s": 60, "alpha": 0.8})
```











 ) , щоб відкрити вигляд доповідача