Infrared (IR) diffuse reflectance spectroscopy is an emerging technology that relies on statistical relationships between IR soil spectra and results obtained from ‘conventional’ measurements, in this case for TOC. The technique has also been used to quantify SOC fractions (Cozzolino and Morón 2006; Zimmermann et al. 2007).
This non-destructive analytical option for soil C follows developments in spectrometer hardware covering near infrared reflectance (NIR: e.g. 750–2500 nm) and mid infrared reflectance (MIR: e.g. 2500–25 000 nm) in conjunction with smart statistical software. Fundamental is the knowledge that different IR absorption bands exist that can be assigned to spectral overtones and combinations of the fundamental vibrations (Beech et al. 2003) associated with chemical bonding of C, H and O, etc., such as C=C, C-H, C-O, C=O, OH, COOH, etc. (e.g. see Table 35-3 of Swift 1996). Relative peak intensities, commonly but not exclusively assessed using partial least square regressions, help to achieve quantitative analysis (Stevens et al. 2008).
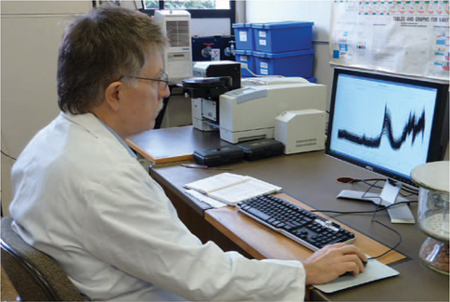
Laboratory methods for TOC using both NIR (e.g. Dalal and Henry 1986; Reeves et al. 1999; Stevens et al. 2008) and MIR (e.g. Janik and Skjemstad 1995; Janik et al. 1998; McBratney et al. 2006) spectra are provided in Methods 6B4a and 6B4b, respectively. Each laboratory must confirm that strong, robust relationships exist between outputs from their specific IR analyser/s and conventional measurements of SOC. Regional or national calibration datasets may become available, derived by ‘fingerprinting’ modal examples from ‘legacy’ and new soil collections (Viscarra Rossel et al. 2008). Moreover, if the conventional measurements were expressed on an oven-dry basis, then the IR results for TOC will also apply to oven-dry soils. Sequential scans typically take ≈1–2 min/sample. Unless predetermined otherwise by the calibration dataset, the soil samples should be ≈40°C air-dry and finely ground (<0.5 mm) at the time of scanning. Figure 6.3 shows the small amount of laboratory bench-space required for IR instrumentation.
Figure 6.3. Examining NIR and MIR spectra from multiple soils as part of the task of calibrating the instrument to measure soil C (and a range of other soil properties).